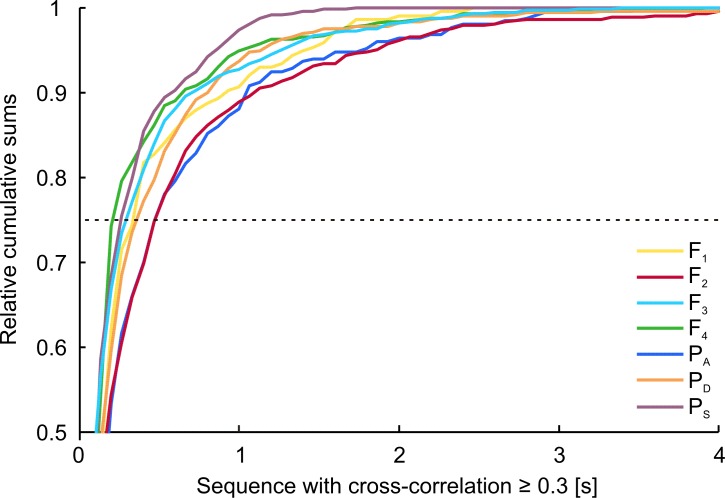
Fig 11. Sequences of electrical discharge interactions.
Relative cumulative sums (RCS) of time periods with a cross-correlation coefficient ≥ 0.3. The graphs illustrate the proportions of sequences of a given length based on playback condition for temporal correlations between EODs of M. rume and the mobile dummy fish. Statistical comparisons between the effects of the different playbacks were performed at a RCS of 0.75. At this value, 75% of all sequences were shorter than the x-axis intersection of their respective graph with the dashed line.

