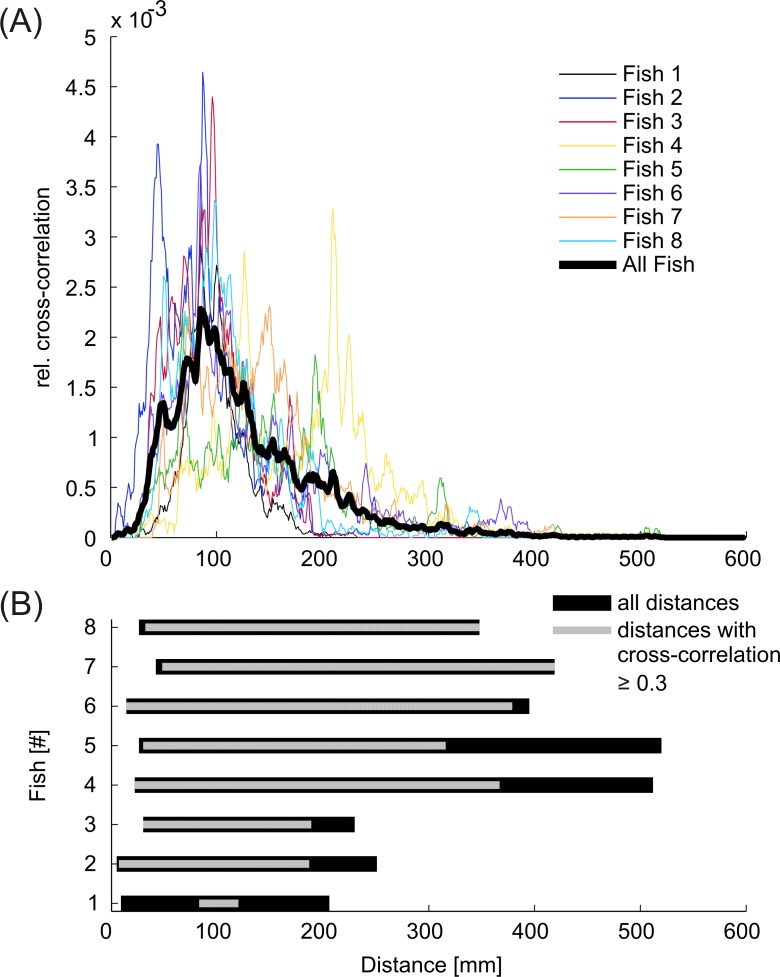
Fig 15. Influence of distance on interactive signaling.
(A) Relative amount of correlation between discharge events of individual M. rume and playback F2 depending on the distance between the animal's snout and the closest point of the dummy fish. On average (thick black line) correlation was highest when fish and dummy were approximately 90 mm apart. (B) The total range of distances kept between each fish and the mobile dummy (black) is contrasted with the range of distances where correlations between the discharges of M. rume and playback F2 exceeded 0.3 (grey).

