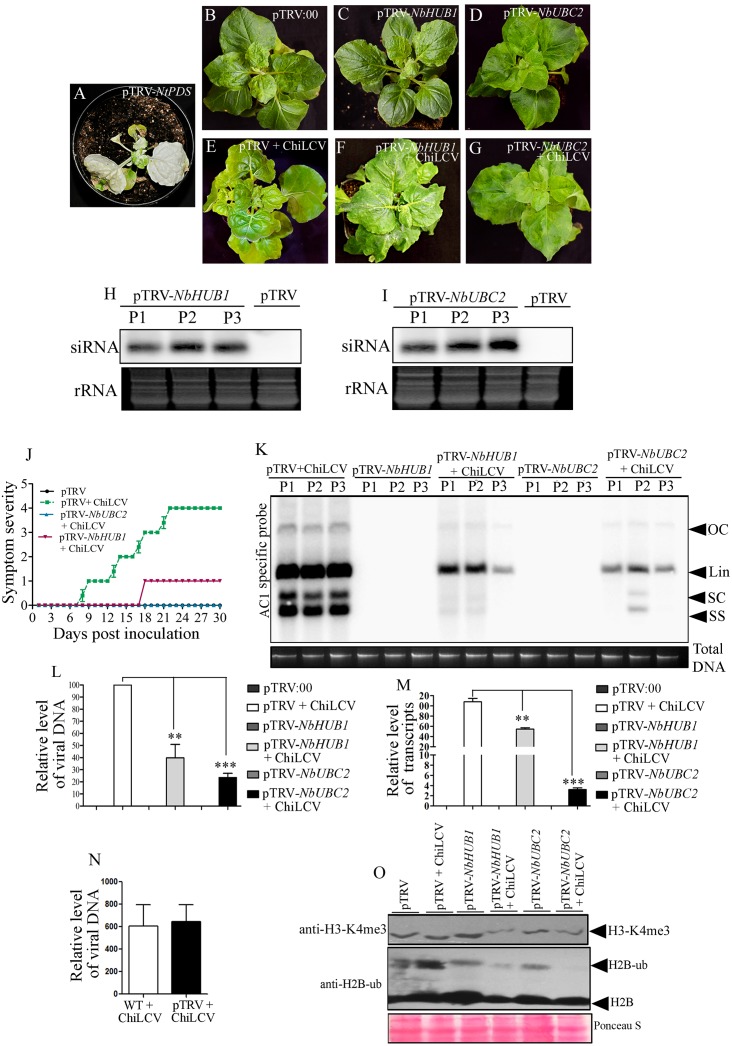
Fig 2. Silencing of NbUBC2 and NbHUB1 affected ChiLCV pathogenesis and deposition of H2B-ub and H3-K4me3 on the viral genome.
(A-G) Phenotype of N. benthamiana plants infiltrated with pTRV-NtPDS, empty vector (pTRV: 00), with or without ChiLCV inoculated, pTRV-NbUBC2, pTRV-NbHUB1 plants at 21 dpi. (H) Detection of NbHUB1 specific siRNAs in three independent silenced plants (P1, P2, P3) of N. benthamiana. (I) Detection of NbUBC2 specific siRNA in three different silenced plants of N. benthamiana. (J) Symptom severity graph showing disease development of ChiLCV on pTRV:00, NbUBC2-, and NbHUB1-silenced N. benthamiana plants. (K-L) Relative level of ChiLCV DNA accumulation in either mock-, or virus-inoculated silenced plants by Southern blot and qPCR assays. Total plant DNA loaded is indicated below the blot (K). The statistical significance between the mean values was calculated by t-test (***p<0.001, **p<0.01). (M) Expression analysis of C2 transcripts level in pTRV:00, NBUBC2-andNbHUB1-silenced plants inoculated with ChiLCV (21 dpi). The statistical significance of the differences between the mean values were calculated by performing t-test (***p<0.001, **p<0.01). (N) An analysis of the viral titer in the absence (WT) or in the presence of pTRV infiltrated N. benthamiana plants inoculated with ChiLCV at 21 dpi. (O) Detection of H3-K4me3 and H2B-ub in NbUBC2, and NbHUB1 silenced N. benthamiana plants by immunoblotting assays.

