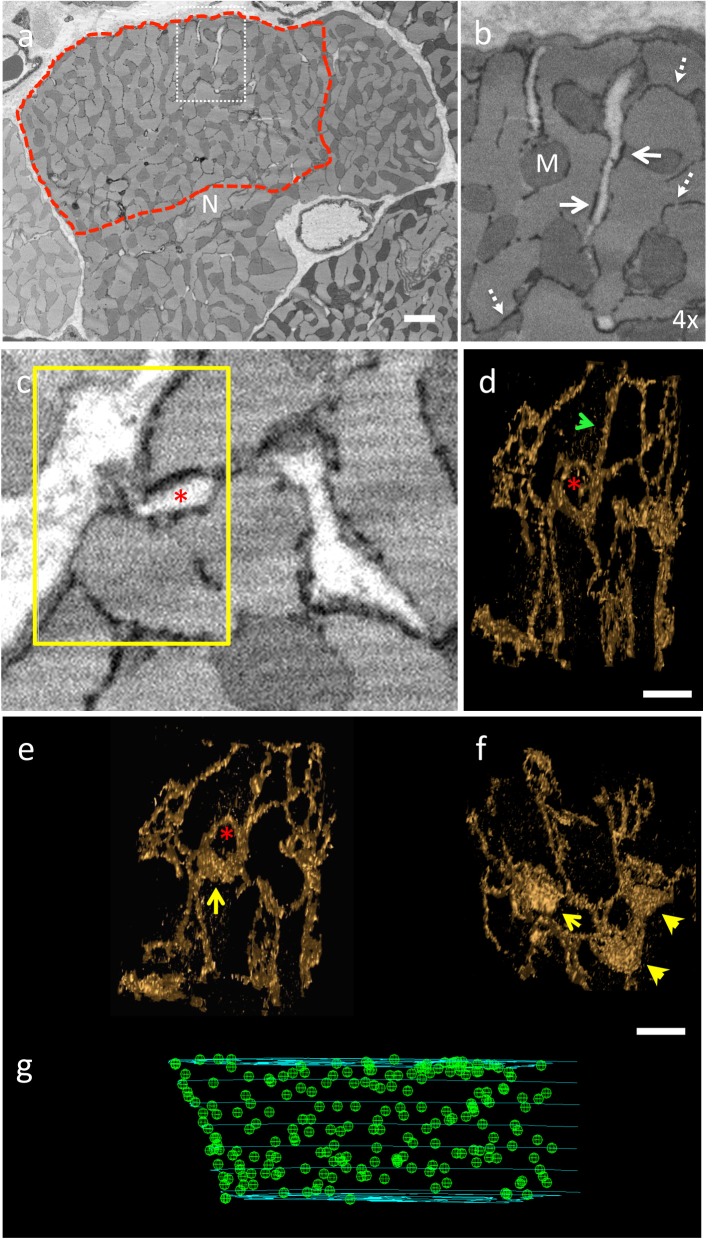
Fig 1. The application of serial block face scanning electron microscopy to analyse the distribution of the dyads, sites of Ca2+ release, within a cardiac myocyte.
(a) Exemplar portion of a serial image taken from an SBF-SEM stack showing a cardiac myocyte in cross-section. The t-tubules are white (no stain uptake) and the SR is black (electron dense). N = nucleus. The region enclosed by the dashed red line highlights the portion of the cell through which the jSR (dyads) were mapped. Scale bar (in white) = 2μm. The boxed region (white dash) is magnified in panel (b) to illustrate the SR morphology, black density, (dashed arrows) and the relationship with the t-tubules to form dyads (white arrows). M = mitochondria (c) The region highlighted by the yellow box indicates an exemplar region through which the SR 3-D structure has been determined to illustrate how it is formed from network SR and jSR. (d) 3-D structure of the SR isosurface (gold), rotated to display where the SR circles a t-tubule (not shown for clarity but position indicated by red asterisk). An example of network SR is indicated by a green arrowhead. Scale bar = 500 nm (e) Rotation of the 3-D structure shown in (d) to illustrate that the portion of SR wrapped around the t-tubule is a jSR patch (yellow arrow) (f) Reconstruction of the SR deeper into the image stack (Z-direction) reveals several other jSR patches (yellow arrowheads). Scale bar = 500 nm (g) Shows a portion of the volume through which the positions of the jSR patches (each jSR indicated by a green sphere) have been identified and mapped within the region encompassed by the red boundary shown in panel (a). The positions of jSR were identified through 357 images (17.85 μm) in the Z-direction.

