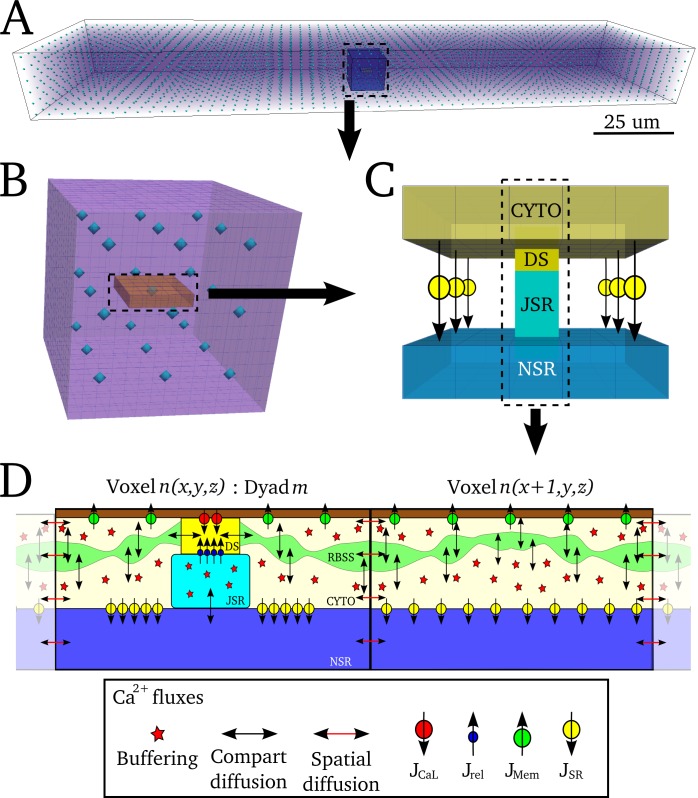
Fig 4. Schematic structure of idealised 3-D spatio-temporal Ca2+ handling model.
A) Whole cell grid (purple volume view), with voxels corresponding to dyads shown by the blue contour dots. B) Enlarged view of a small portion of the whole cell grid containing 3x3x3 dyads, corresponding to the highlighted portion shown in (A). A 5x5 voxel slice containing a single dyad at the centre is shown in orange. C) Illustration of the cytoplasm and nSR domains contained within the 5x5 slice in (B), with the dyadic cleft and jSR shown. Flux JSR is illustrated between corresponding voxels of the CYTO and NSR grids. D) Schematic of two voxels of each domain, with one containing a dyad. The RBSS and CYTO compartments of the CYTO grid are shown. Continuous Ca2+ diffusion occurs within the CYTO, RBSS and NSR grids. DS refers to the dyadic cleft space.

