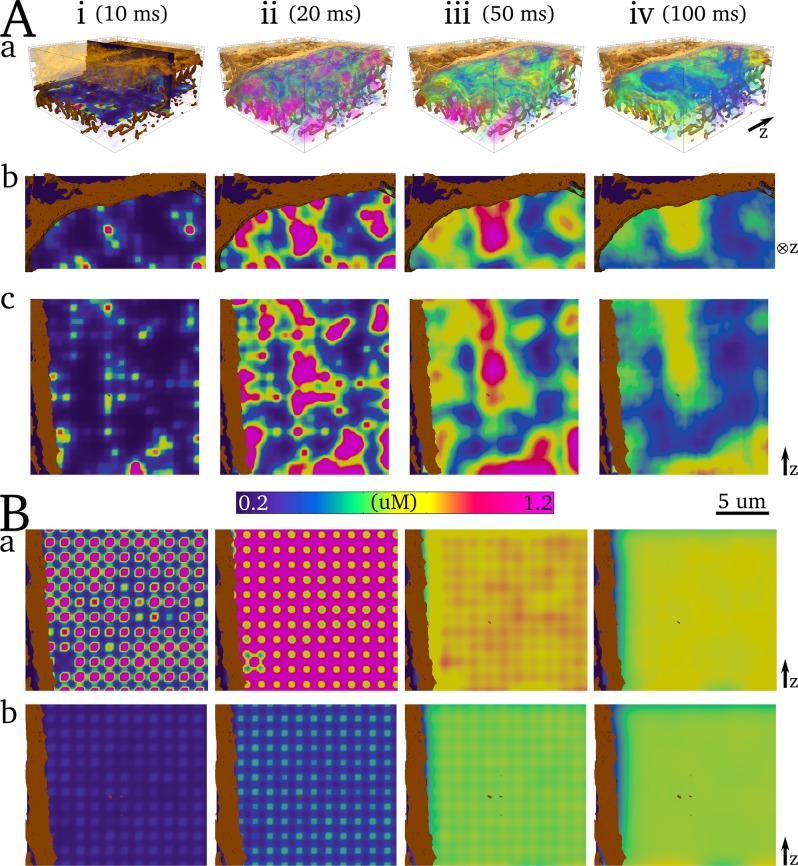
Fig 8. Spatial Ca2+ gradients during normal excitation.
Aa) Intracellular Ca2+ concentration in a 3-D volume of the cell. A transparent volume render is used with spikes of increased opacity at various intervals to provide contour lines. Surface sarcolemma and TT reconstructions are shown in brown contour for reference; b) and c) correspond to the same 2D slices in Fig 7. B) 2D slices during normal excitation in the semi-idealised cell model, a) is in the plane of the dyads and b) is in-between dyad planes. In contrast to Fig 7, the colour-map is scaled to reveal the local peaks of Ca2+ concentration significantly larger than the whole-cell average and highlight the gradients–note also the lower limit. Further renders of the 3-D intracellular Ca2+ gradients can be found in in the S3 Fig and a high resolution version is available at http://physicsoftheheart.com/.

