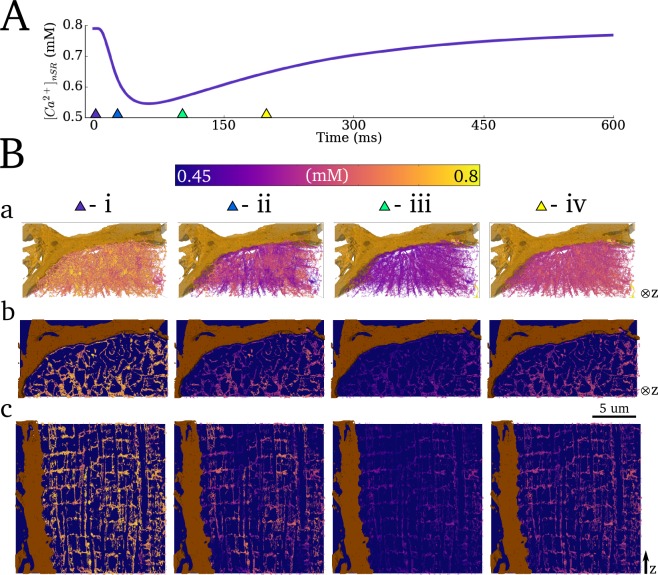
Fig 9. Spatio-temporal Ca2+ dynamics in the network SR.
A) Whole-cell SR Ca2+ concentration during a single beat. B) Temporal snapshots of spatial Ca2+ concentration a) in the full 3-D network SR; b) and c) in pseudo-slices of the cross-sectional and longitudinal planes. Pseudo-slices are comprised of thin 3-D clips and are equivalent to the slices in previous figures. Triangular markers in (A) indicate the timings of the corresponding panels (Bi-iv)– 10ms, 25ms, 100ms and 200ms relative to the applied stimulus. A high resolution version is available at http://physicsoftheheart.com/.

