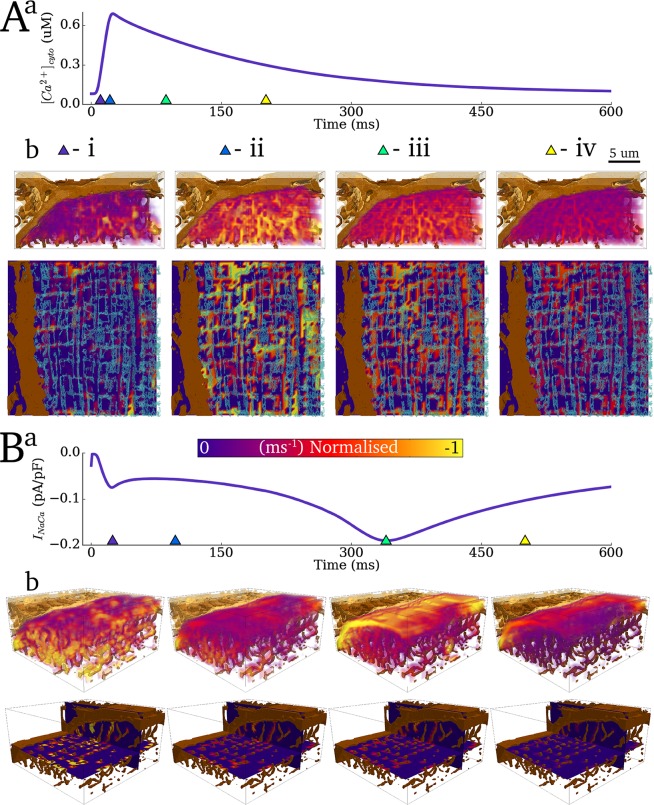
Fig 10. Evaluation of Jup and JNaCa fluxes in the cytoplasm.
A) Spatial distribution of the magnitude of Jup (b) with the Ca2+ transient shown as a reference (a). The blue semi-transparent contour render is a pseudo-slice of the SR for reference. B) Spatial distribution of the magnitude of JNaCa (b) with the whole-cell average current shown as a reference (a). Triangular markers in the upper panels indicate the timings relative to the applied stimulus of the corresponding lower panels i-iv. For Jup (A) these correspond to 10ms, 25ms, 100ms and 200ms; for JNaCa (B) these correspond to 25ms, 100ms, 345ms and 500ms.

