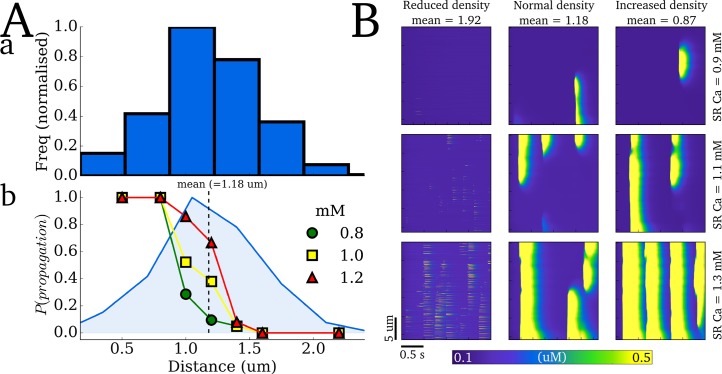
Fig 15. Criticality in Ca2+ spark propagation.
Aa) Histogram of the nearest neighbours for each dyad in the structurally detailed model and b) probability of Ca2+ spark-induced-spark propagation in a two-dyad model at different SR Ca2+ concentrations (indicated in the figure legend). The dyad distribution is imposed for reference and the mean nearest neighbour inter-dyad distance is show by the dotted line. B) Ca2+ spark hierarchy at different mean nearest neighbour distances (left to right) for different SR Ca2+ loads (top to bottom), simulated in the cross-sectional portion cell model.

