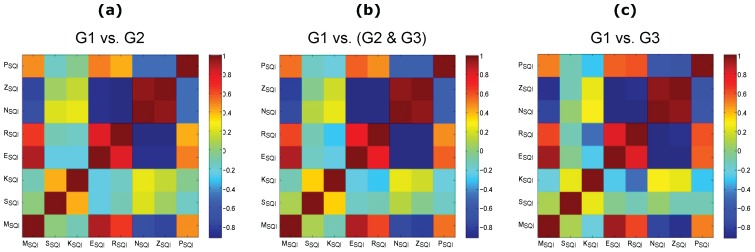
Figure 2.
Correlation between the signal quality indices based on the adjudicated photoplethysmogram (PPG) signals. (a) excellent PPG signal quality (G1) versus acceptable PPG signal quality (G2); (b) G1 versus (G2 and unfit to diagnose PPG signals (G3)); and (c) G1 versus G3. Signal quality indices: perfusion (), kurtosis (), skewness (), relative power (), non-stationarity (), zero crossing (), entropy (), and the matching of systolic wave detectors (). Here, the red color and the blue color indicate strong correlation and anti-correlation, respectively.

