
Figure 1.
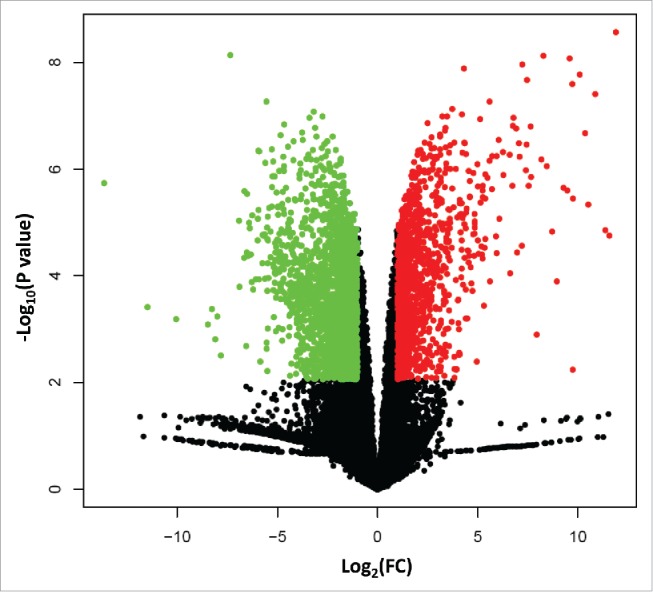
A volcano plot shows the upregulated genes (red dots) and downregulated genes (green dots) in 3D cells relative to 2D cells. The X-axis shows log base 2-fold change (log2FC), and Y-axis indicates edgeR statistics of P values in –log base 10 scales.