Figure 2.

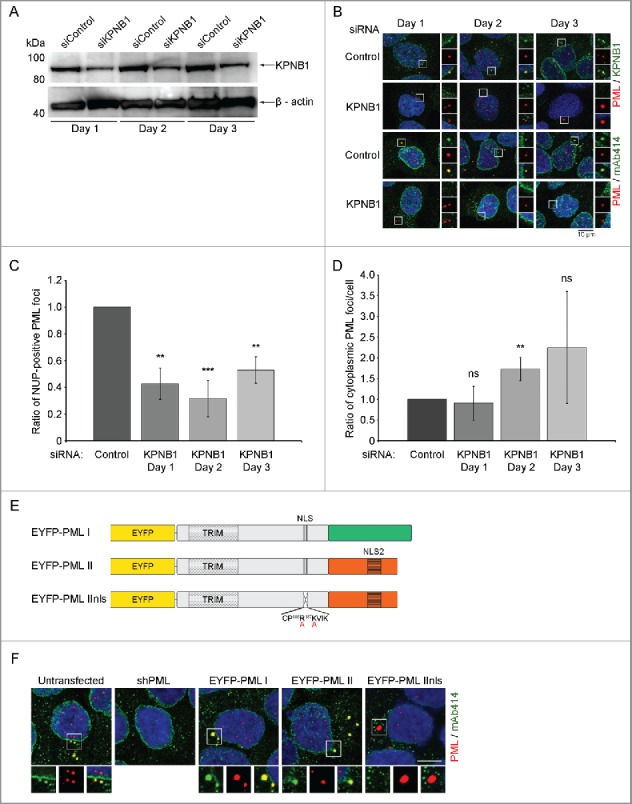
KPNB1 controls recruitment of NUPs to CyPNs. (A) Western blot showing expression of KPNB1 in KPNB1-depleted and control-depleted U2OS cells. β-actin was used as a loading control. The blot is representative of 3 independent experiments. (B) IF labeling of siRNA transfected cells using antibodies against PML (red) in combination with antibodies against FG-NUPs (mAb414; green) or KPNB1 (green). Each image represents projections of multiple z-sections. Selected cytoplasmic foci are highlighted. DAPI is shown in blue. (C) Quantification of the data shown in (B). The ratio of NUP-positive PML foci was determined by manual inspection of more than 300 cells in each sample and the data was normalized to the control. The bar graph shows mean ± standard deviation (SD) calculated from 3 independent experiments (**p < 0.01, ***p < 0.001). (D) Quantification of the data shown in (B). The ratio of cytoplasmic PML foci per cell was determined by manual inspection of more than 300 cells in each sample and the data was normalized to the control. The bar graph shows mean ± standard deviation (SD) calculated from 3 independent experiments (ns = non-significant; **p = 0.01). (E) Schematic of lentivirus-based constructs. The isoform-specific C-terminus is shown in green and orange for PML I and II respectively. The TRIM motif, the central NLS (in exon 6) and the PML II specific NLS (NLS2) are also depicted. Furthermore, the alanine substitutions in the central NLS of PML IInls are indicated with red letters. (F) The first 2 panels show IF labeling of endogenous FG-NUPs (mAb414; green) and endogenous PML (red) in untransfected and shPML-transfected HaCaT cells, respectively. The remaining panels show autofluorescent EYFP-tagged PML (red) and endogenous FG-NUPs (mAb414; green). DAPI is shown in blue. Each image represents projections of multiple z-sections. Selected cytoplasmic PML bodies are highlighted to demonstrate the absence or presence of FG-NUPs. Scale bar 10 µm.
