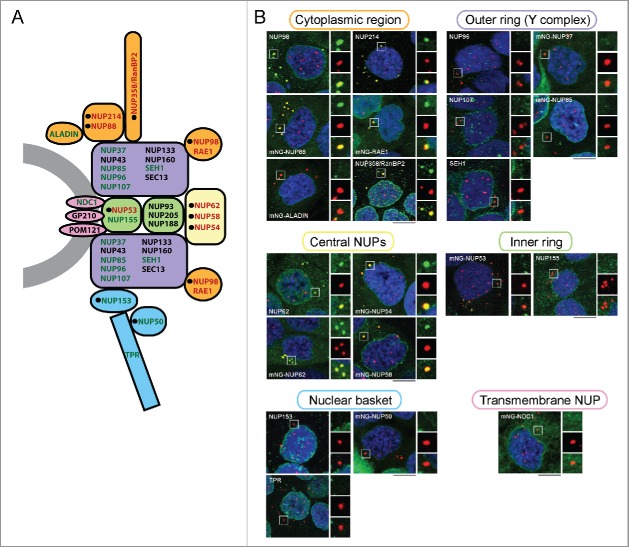
Figure 3.
CyPNs preferentially recruit peripheral NUPs. (A) Cross section of a nuclear pore complex showing localization of NUPs within NPC subcomplexes. NUPs that we detect in CyPNs are shown in red and NUPs that we do not detect in CyPNs are shown in green. Black circles indicate NUPs with FG-motifs. NUPs that have not been analyzed in the present study are shown in black. The schematic representation of the NPC used here is based on previous publications.1,26,64 (B) IF labeling showing the localization of PML (red) and indicated NUPs (green) in G1 HaCaT cells. NUPs were detected either as stably expressed mNG fusions (autofluorescence) or as endogenously expressed proteins using NUP-specific antibodies. Each image represents projections of multiple z-sections. Selected CyPNs are highlighted to demonstrate the absence or presence of the indicated NUPs. Scale bars 10 µm.

