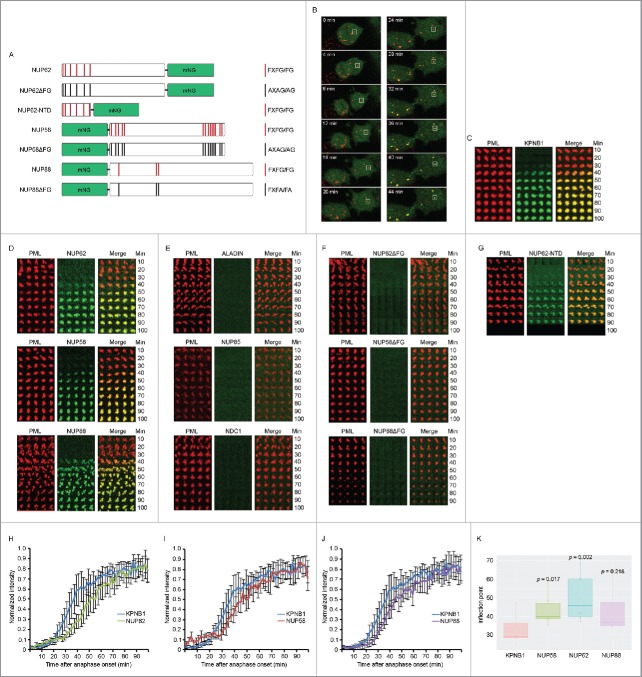
Figure 4.
Post-mitotic recruitment of KPNB1 and FG-NUPs to CyPNs in living cells. (A) Schematic overview of the mNG-tagged FG-repeat NUPs NUP62, NUP58, NUP88 and their mutated versions. (B) Time lapse of a dividing HaCaT cell expressing mRFP-PML I (red) and mNG-KPNB1 (green). Time point zero is defined by anaphase onset. The complete mitosis is shown in Video S2. (C) Tracking of a single PML body in HaCaT cells expressing mRFP-PML I (red) and mNG-KPNB1 (green). Confocal z-stacks were acquired at 2 min intervals between frames. Time point zero is defined by anaphase onset. (D) Tracking of a single PML body in HaCaT cells stably expressing mRFP-PML I (red) and one of the indicated mNG-tagged FG-NUPs (green). Data were acquired as aforementioned in (C). (E) Tracking of a single PML body in HaCaT cells stably expressing mRFP-PML I (red) and one of the indicated mNG-tagged scaffold NUPs (green). Data were acquired as aforementioned in (C). (F) Tracking of a single PML body in HaCaT cells stably expressing mRFP-PML I (red) and mNG-tagged mutated versions of the indicated FG-NUPs (green). Data were collected as aforementioned in (C). (G) Tracking of a single PML body in HaCaT cells stably expressing mRFP-PML I (red) and mNG-tagged N-terminal FG-repeat region of NUP62 (green). Data were collected as aforementioned in (C). (H-J) Quantification of PML body tracking data showing normalized fluorescence intensity measured through the center of a MAPP/CyPN in single z-sections. Images were acquired at 2 min intervals between frames. Time point zero is defined by anaphase onset. Graphs show mean ± SD of intensity measurements from 6–10 CyPNs assembled in different cell divisions. Lines represent detection of mNG-tagged KPNB1 and NUP62 (H), KPNB1 and NUP58 (I), as well as KPNB1 and NUP88 (J) respectively. (K) Statistical analysis of KPNB1 versus NUP recruitment to cytoplasmic PML foci. Boxplot represents the inflection points calculated from fitted sigmoid curves shown in Fig. S7B. Indicated p-values were obtained by a Wilcoxon Rank sum/Mann-Whitney test, with Bonferroni multiple testing correction.

