
Figure 3.
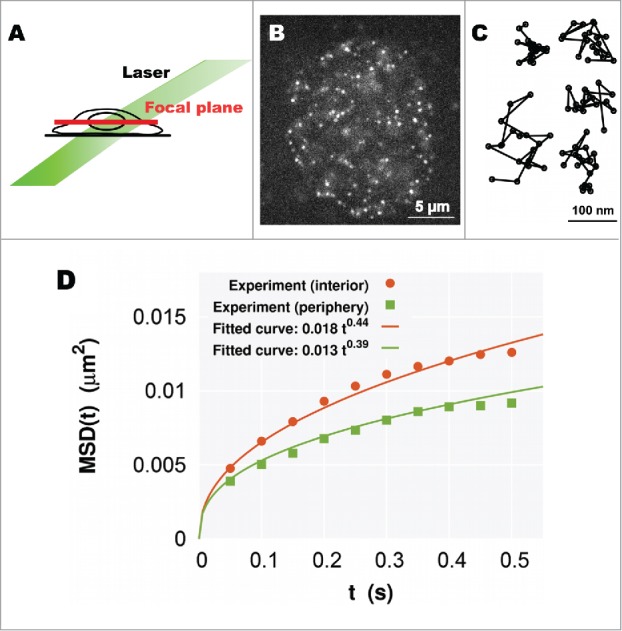
(A) A simple scheme for oblique illumination microscopy. An illumination laser (green) and focal plane (red) in a living cell are shown. (B) Single-nucleosome image of a human HeLa cell nucleus expressing H2B-PA-mCherry. Each dot represents a single nucleosome (adopted from ref. 24). (C) Representative trajectories of fluorescently labeled single nucleosomes (50 ms per time frame). (D) Plots of the MSD at the interior (orange) and periphery (green) regions. Each plot fits well with the MSD curve for subdiffusion (Eq. (1)).