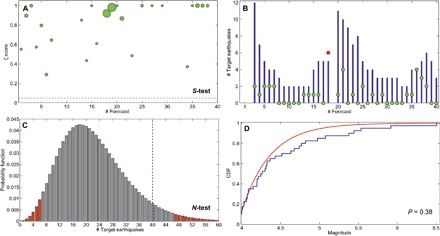
Fig. 3. Results of the statistical tests.

(A) The quantile score ζ for each forecast of Table 1. Dot size is proportional to the number of target earthquakes that occurred during the forecasting time window; the red dashed horizontal line is the critical value (ζ = 0.05) for rejection. (B) Expected number of target earthquakes for each forecast, calculated with negative binomial distribution (NBD) at 99% (see Materials and Methods). The green and red dots represent the following observations: green if inside the expected range and red if otherwise. (C) Probability distribution of the expected number of target earthquakes with a 95% confidence interval (red tails) and the observed number of target earthquakes (vertical dashed blue line). (D) Plot of the forecast and observed frequency-magnitude distribution. The P value of the Lilliefors test is reported inside the plot. These results show that the space-time-magnitude distribution of the forecasts and of the target earthquakes is in agreement.
