
Fig. 2. Cell survival and proliferation in TMS.
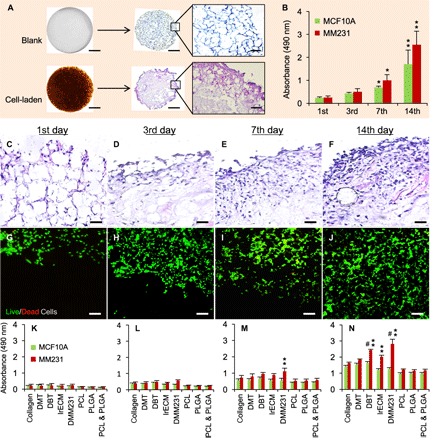
(A) Macroscopic and microscopic views of the blank and cell-laden porous DBT-TMSs. Scale bars, 1 mm (for the macroscopic views and the microscopic views of the H&E-stained cross sections) and 200 μm (for the regional blowups of the H&E-stained cross sections). (B) Proliferation of MCF10A and MM231 cells grown on DBT-TMSs over a period of 14 days. Error bars represent the SD of the means of the values from three independent experiments. *P < 0.01; **P < 0.001, compared to the first-day culture. (C to F) The proliferation and distribution of the MM231 cells on the DBT-TMSs were examined on the cross sections of the scaffolds using H&E staining coupled with light microscopy. Scale bars, 100 μm. (G to J) Live/Dead Cell assays showing robust survival and proliferation of the MM231 cells on the DBT-TMSs over time. Scale bars, 100 μm. The images (C to J) are top (surface) to bottom (center) views of the cross sections of the scaffolds. (K to N) Comparison of MCF10A and MM231 cell proliferation profiles on different 3D scaffolds within the defined time frame. Error bars represent the SD of the means of three independent experiments. **P < 0.01, compared to the proliferation profiles on the PCL/PLGA scaffolds; #P < 0.05, compared to the proliferation profiles on the collagen scaffolds.