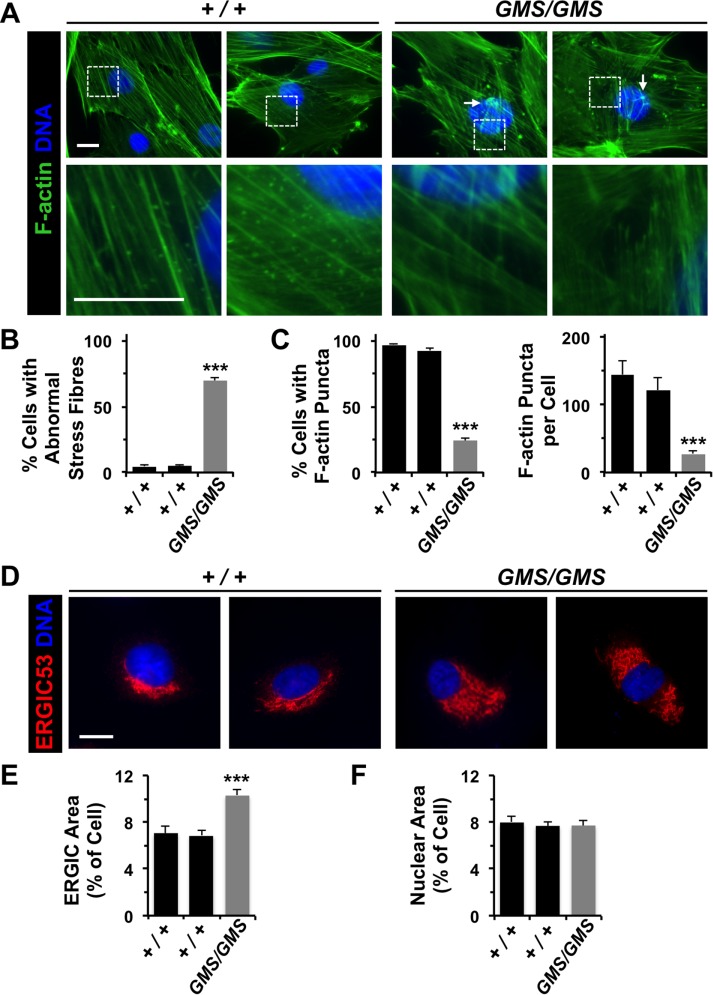
FIGURE 4:
Amish GMS fibroblasts have altered F-actin organization and ERGIC morphology. (A) Fibroblasts from two healthy (+/+) Amish individuals or Amish GMS (GMS/GMS) patients were stained with phalloidin to visualize F-actin (green) and with DAPI to label DNA (blue). Unusual orthogonal bundles of F-actin fibers and aggregates are highlighted with arrows. A lack of cytoplasmic F-actin puncta in GMS cells is exemplified in the row of magnified images. (B) The percentage of cells with aberrant (orthogonal, aggregated, or stellate) F-actin stress fibers was quantified. Each bar represents the mean (+ SEM) from analyses of 350 cells. ***, p < 0.001 (Fisher’s exact test). (C) The percentage of cells with prominent cytoplasmic F-actin puncta in the juxtanuclear region was quantified. Each bar represents the mean (+ SEM) from analyses of 350 cells. For cells with puncta, the number per cell was also quantified. Each bar represents the mean (+ SEM) from analyses of 12 cells. ***, p < 0.001 (Fisher’s exact test, ANOVA). (D) Wild-type or GMS fibroblasts were stained with antibodies to detect ERGIC-53 (red) and with DAPI to label DNA (blue). (E, F) The areas occupied by the ERGIC, nucleus, and entire cell were calculated in ImageJ and converted to a ratio of organelle area/cell area. Each bar represents the mean (+ SEM) from analyses of 25 cells. ***, p < 0.001 (ANOVA). All scale bars: 10 μm.

