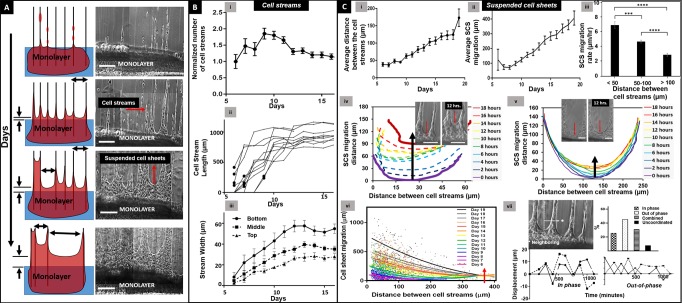
FIGURE 3:
Collective migration. (A) Representative schematics and time-lapse images of cell stream and SCS advancement over time. Scale bars: 200 µm. (B) (i) Average number of cell streams normalized with respect to average number of cell streams on day 6. (ii) Kinetics of cell stream (n = 10) advancement. The black dots represent the instances when the cell stream length exceeded 100 μm. (iii) Average cell stream (n = 10) width measured at three locations: top, middle, and bottom of the cell streams over days. (C) (i) Increase in average distance between the cell streams (number of cell streams (n) = 2400). (ii) Average suspended cell sheet advancement distance over time. (iii) Decreasing SCS speed as a function of increasing cell stream separation distance (n = 966). Asterisks show statistical significance. (iv, v) Examples of individual SCS front advancement-distance over time shown by black arrows in overlay of profiles for SCS separated by 60 and 250 μm, respectively. Insets are corresponding phase-contrast images showing SCS advancement over 12 h. Scale bars: 100 µm. (vi) Temporal relationship between SCS and cell stream advancement distances (n = 2400). Red arrow indicates compromised SCS advancement beyond 375-µm cell stream separation distance. (vii) Representative examples of in-phase and out-of-phase displacement patterns over time of neighboring SCS. Frequency percentages of neighboring SCS advancing in in-phase, out-of-phase, combined in-phase and out-of-phase, and not-coordinated modes (number of independent SCS pairs, n = 64).

