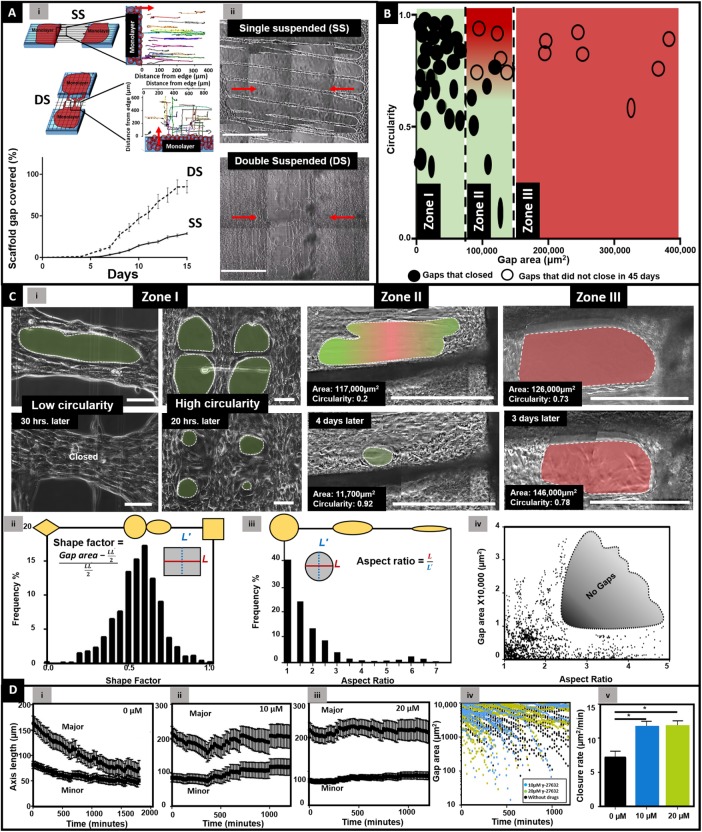
FIGURE 4:
Formation and closure of gaps. (A) Schematics of SS and DS closure dynamics along with tracks of cells on respective scaffolds (n = 25 per category). Near-complete closure of simulated gap is achieved by cross-hatch network (DS, N = 9) compared with parallel networks (SS, N = 7). (ii) Phase-contrast images of SS and DS closure on day 12. Scale bar: 500 μm. Red arrows indicate cell migration direction from monolayer. (B) Circularity and area of gaps that closed and did not close over a period of 45 d (number of individual gaps, n = 49). (C) (i) Phase-contrast images of gaps that closed and did not close in the three zones. Analysis of gap shape as frequency percentage using two metrics of (ii) SF (n = 1094), (iii) AR (n = 1360) of the gaps with areas <40,000 μm2, and (iv) gap area as a function of AR (n = 819). No gaps were observed in shaded region, suggesting large-area gaps do not form as elongated ovals (high AR). (D) (i) Changes in major and minor axes of the gaps with (i) 0 μM (n = 25), (ii) 10 μM (n = 9), and (iii) 20 μM (n = 20) y-27632 exposure. (iv, v) Closure of small (< 10,000 μm2) gaps with y-27632 exposure (black: 0 μM; blue: 10 µM; green: 20 µM y-27632) demonstrating significantly faster closures when exposed to 10 (n = 20) and 20 (n = 38) μM y-27632 concentrations compared with those not (n = 25) exposed to y-27632. Asterisk shows statistical significance.

