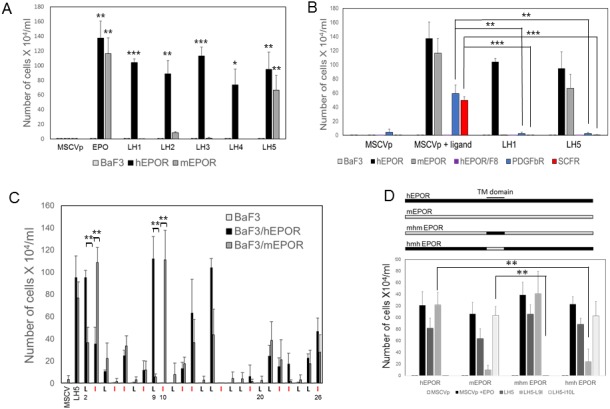
Figure 2. Specificity of traptamer action.

(A) BaF3, BaF3/hEPOR and BaF3/mEPOR cells stably expressing empty MSCVp vector or the indicated traptamer were incubated in medium lacking IL-3. MSCVp cells were also incubated in the presence of EPO, as indicated. The number of live cells was counted six days after IL-3 removal. The bars show mean ± SEM for three independent experiments. For clarity, in all graphs, values for samples with no growth were arbitrarily set at 0.5 × 10⁴ cells/ml. Statistical significance of differences between cells expressing MSCVp and cells expressing a traptamer were evaluated by two-tailed Student’s t-test with unequal variance (*p≤0.05; **p≤0.02; ***p≤0.005). (B) BaF3 cells and BaF3 cells expressing wild-type hEPOR, F8 (a phosphorylation-defective mutant of the hEPOR), mEPOR, PDGFβR or SCFR were infected with MSCVp or MSCVp expressing LH1 or LH5. After puromycin selection, cells were incubated in medium lacking IL-3. Cells expressing MSCVp were also treated with the cognate ligand, as indicated: EPO for EPOR and F8, PDGF for PDGFβR, and stem cell factor for SCFR. The number of live cells was counted six days after IL-3 removal. The bars shown mean ± SEM for three independent experiments. Statistical significance of differences between cells treated with ligand and cells expressing a traptamer were evaluated by two-tailed Student’s t-test with unequal variance (**p≤0.02; ***p≤0.005). (C) Sequence of LH5 starting at position two is shown at the bottom, with isoleucines colored red. Each leucine was mutated individually to isoleucine and each isoleucine was mutated to leucine. BaF3, BaF3/hEPOR and BaF3/mEPOR cells were infected with MSCVp or MSCVp expressing LH5 or one of the LH5 mutants. After puromycin selection, cells were incubated in medium lacking IL-3. In cells expressing a traptamer with a mutation at the indicated position, the number of live cells was counted six days after IL-3 removal. The bars show mean ± SEM for three independent experiments. For each mutant, statistical significance of differences between cells expressing hEPOR and cells expressing mEPOR were evaluated by two-tailed Student’s t-test with unequal variance (**p≤0.02). (D) Top panel. Schematic diagram of mhm and hmh chimeric receptors with hEPOR and mEPOR segments shown in black and gray, respectively. Bottom panel. BaF3 cells expressing the hEPOR, the mEPOR, or a chimeric EPOR were infected with MSCVp or MSCVp expressing the indicated traptamer. After selection with puromycin, cells were tested for IL-3 independence. The number of live cells was counted six days after IL-3 removal. The bars show mean ± SEM for three independent experiments. Statistical significance of differences between cells expressing wild-type hEPOR or mEPOR compared to cells expressing a chimeric EPOR were evaluated by two-tailed Student’s t-test with unequal variance (**p≤0.02).
