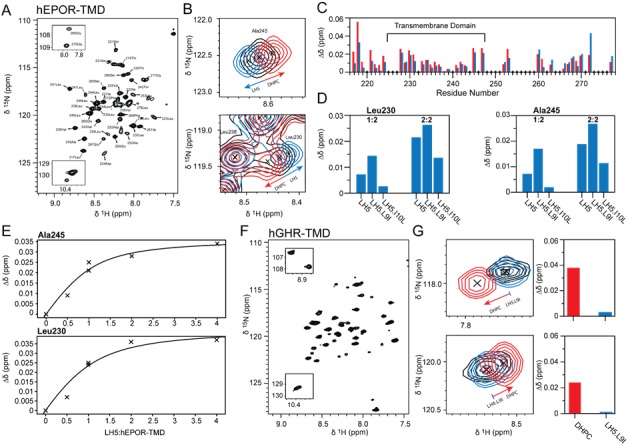
Figure 4. LH5 drives EPOR TMD peptides into dimers in detergent micelles.
(A) 1H,15N- HSQC spectrum of 15N-labelled hEPOR217-277 in DHPC micelles with assignments indicated. (B) Zoomed-in contour plots of hEPOR Ala245 and Leu230 from 1H,15N- HSQC spectra. Peaks from hEPOR217-277 at 30-times molar excess of DHPC are depicted in black, peaks at 60-times molar excess of DHPC in red, and peaks with LH5 in a ratio of LH5:hEPOR:DHPC of 1:1:30 in blue. Increasing the amounts of DHPC or adding LH5 induced opposite effects as indicated by arrows. (C) Weighted chemical shift changes of 15N-hEPOR217-277 backbone amides per residue upon increasing the molar excess of DHPC from 30 to 60 times (red bars) or addition of LH5 in a molar ratio of 1:1 (blue bars). The same residues were affected by LH5 and DHPC, but the peaks move in opposite directions. The hEPOR TMD is indicated by a black horizontal line. Diamonds on the x-axis indicate proline residues, overlapping peaks, and missing assignments. (D) Weighted chemical shift changes of Leu230 and Ala245 backbone amides induced by addition of LH5, LH5-L9I or LH5-I10L at molar ratios of one traptamer molecule to two hEPOR TMDs (1:2) and two traptamer molecules to two hEPOR TMDs (2:2). (E) Weighted chemical shift changes of 15N-hEPOR217-277 Ala245 and Leu230 backbone amides induced by addition of LH5 at different molar ratios of LH5 to hEPOR217-277 in DHPC micelles. Two individual titrations were performed, one from 0:1 to 1:1 (corresponding to the 2:2 traptamer:EPOR TMD ratio) and the other from 0:1 to 4:1 (corresponding to the 8:2 traptamer:EPOR TMD ratio) molar ratio of LH5 to hEPOR217-277. The titration point at 1:1 was recorded in each series. A hyperbola is indicated to guide the eye. (F) 1H,15N- HSQC spectrum of 15N-labelled hGHR238-274 in DHPC micelles. (G) Zoomed-in contour plots of two selected peaks of hGHR from 1H,15N- HSQC spectra. Peaks from hGHR238-274 at 60-times molar excess of DHPC are depicted in black, peaks at 120-times molar excess of DHPC in red, and peaks with LH5-L9I in a ratio of LH5-L9I:hEPOR:DHPC of 2:1:60 in blue. Addition of LH5-L9I did not induce a change in chemical shifts as indicated by the near-complete overlap of the black and blue peaks (Figure 4—figure supplement 3). The extent of the chemical shift changes in the hGHR238-274 spectra is illustrated in the bar graphs showing the changes induced by the DHPC in red and by LH5-L9I in blue for the peaks shown on the left.

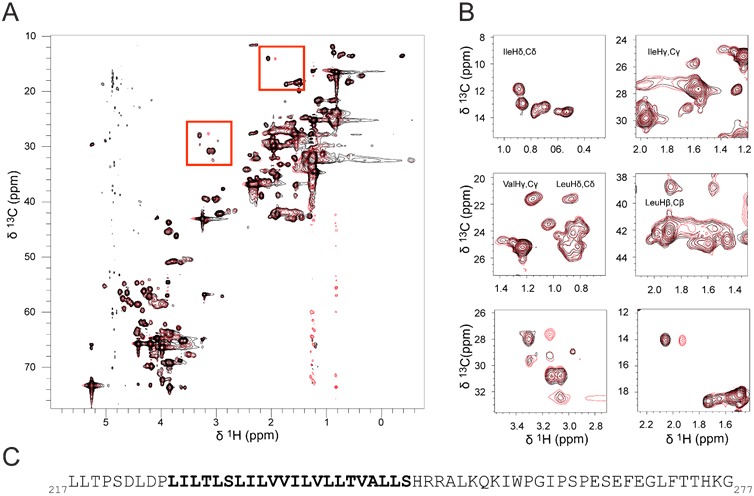
Figure 4—figure supplement 1. hEPOR TMD side chain chemical shift.

Figure 4—figure supplement 2. LH5 mutants drive hEPOR TMD peptides into dimers.

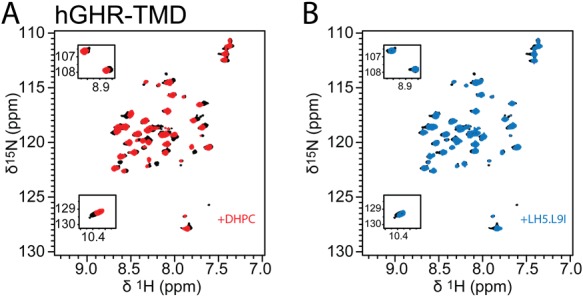
Figure 4—figure supplement 3. LH5-9LI does not change the growth hormone receptor monomer-dimer equilibrium.

