. 2017 Aug 25;6:e28081. doi: 10.7554/eLife.28081

Figure 1. Septate junctions form a permeability barrier at the PSC in the lymph gland.

(a) Schematic representation of the lymph gland (PSC-Posterior Signalling Centre; MZ-Medullary Zone; CZ-Cortical Zone). (a’,a’’) 70kDa-dextran (Red) is excluded from the PSC (Green). (b–d’’) Dual Dye Assay with 70kDa-dextran (Green) and 40kDa-dextran (Red) dextran in wild-type (b–b’’) and following PSC specific knockdown of cora or NrxIV (c–d’’). (e,e’) Pearson’s co-localization co-efficient quantification of data in b-d in PSC and non-PSC cells. (f–f’’) Coracle expression (red) in PSC cells (collier-Gal4 >UAS GFP; green). (g–g’) Enlarged view of boxed region in (f). (h–h’). NrxIV expression (green) in PSC cells (Antp antibody; Red). (i–i’) Coracle expression (red) in MZ cells (tep4-Gal4 > UAS GFP; green). (j–j’) NrxIV expression (green) in CZ cells (P1 antibody; red). (k–k’) Electron micrographs showing septate junctions in between PSC cells. Nuclei labeled with DAPI (Blue). (a’–a’’,f,g) ***=P < 0.001; ns = non significant. Error bars represent s.d. Scale Bars:(a’,a’’,f–f’, i–i’) 50 μm, (b–d’’,g–h’, j–j’) 40 μm, (k) 100 nm (k’) 50 nm.

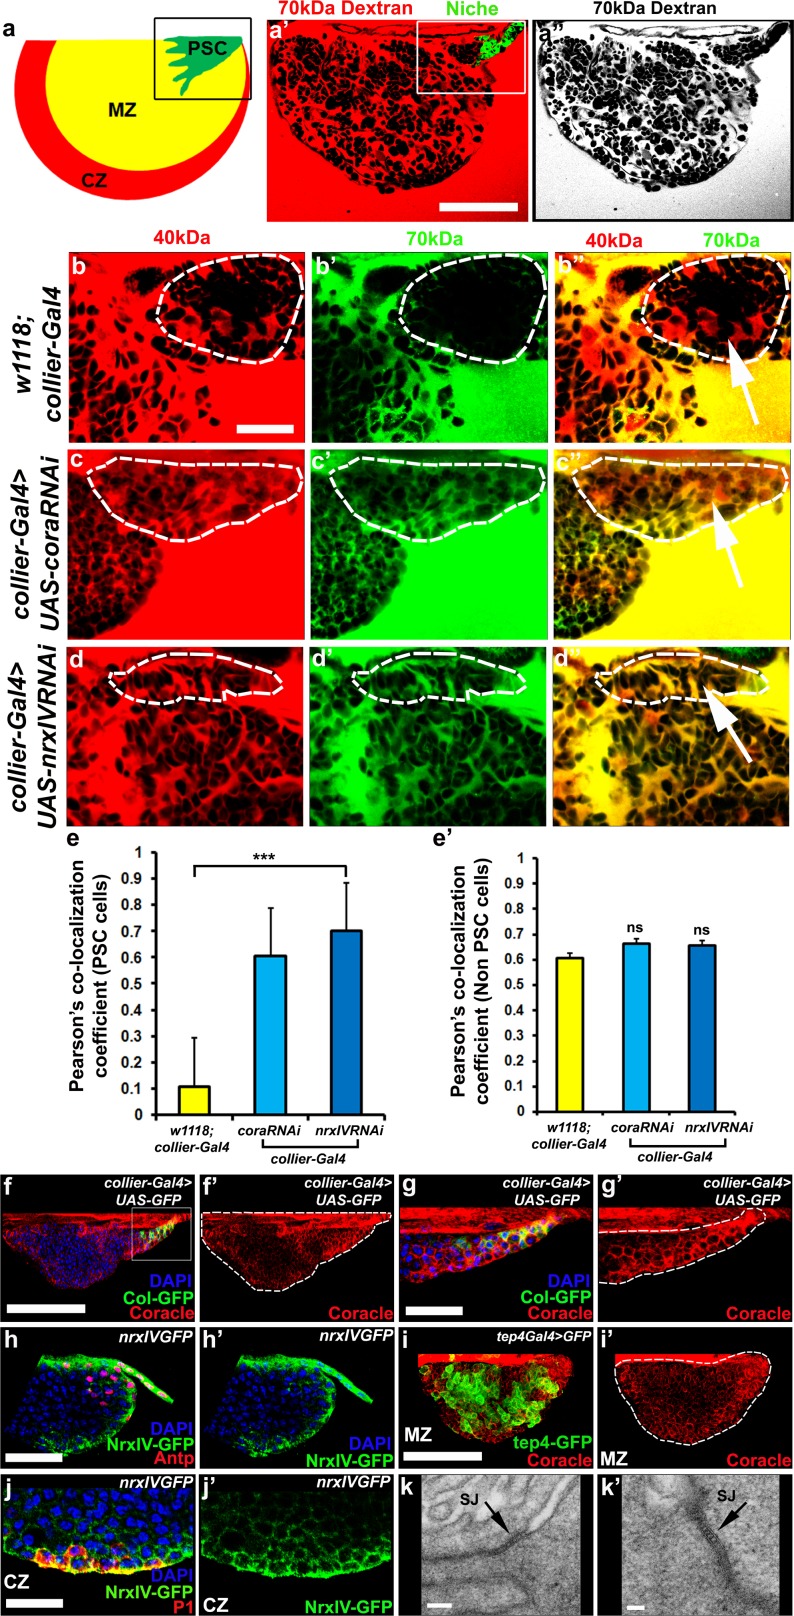
Figure 1—source data 1. Contains numerical quantitation represented in Figure 1e.
DOI: 10.7554/eLife.28081.005
Figure 1—source data 2. Contains numerical quantitation represented in Figure 1e’.
DOI: 10.7554/eLife.28081.006

Figure 1.

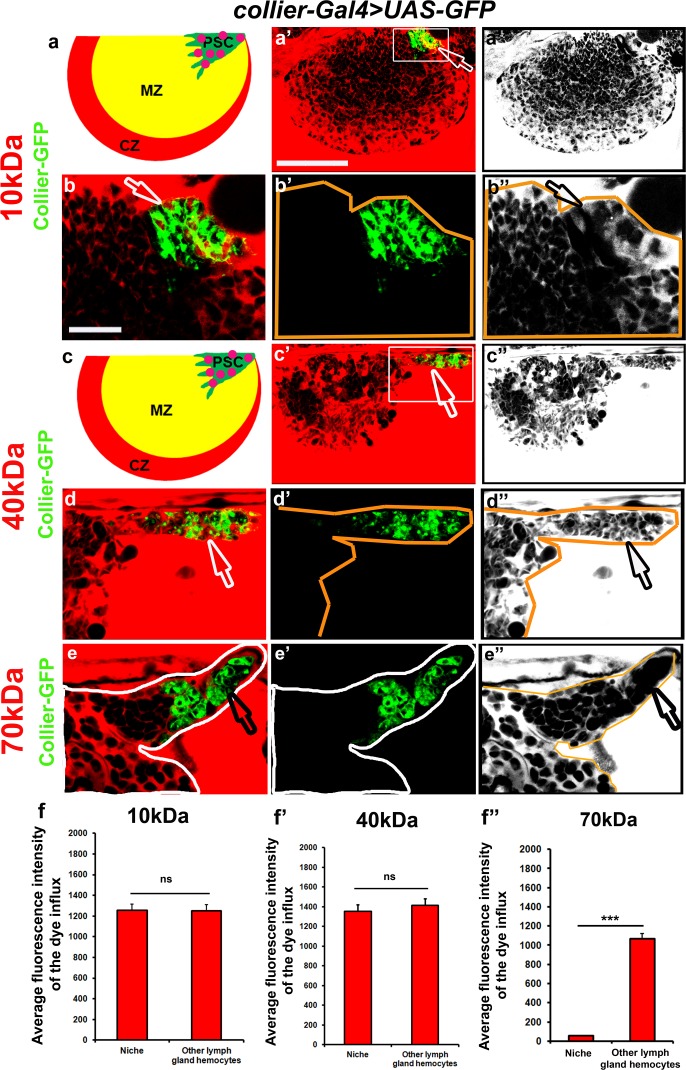
Figure 1—figure supplement 1. Low molecular weight dyes are not excluded from the PSC.

Figure 1—figure supplement 1.

(a’,a’’) 10 and (c’,c’’) 40 kDa dextran (Red) are not excluded from the PSC also shown in the (a,c) schematic representation of lymph glands. (b–b’’ and d–d’’) High-magnification images of boxed region in (a’ and c’). (e–e’’) 70 kDa dextran (Red) is excluded from the PSC. Pink circles represent the 10 and 40 kDa dextran entering the PSC. (f–f’’) Quantitation of 10, 40 and 70 kDa dye influx in the PSC. (a’,b–b’,c’,d–d’ and e–e’) PSC is labeled with Collier-GFP (green; UAS-GFP driven by collier-Gal4). Scale Bar: (a’,a’’ and c’,c’’) 50 μm and (b–b’’,d–d’’ and e–e’’) 40 μm.

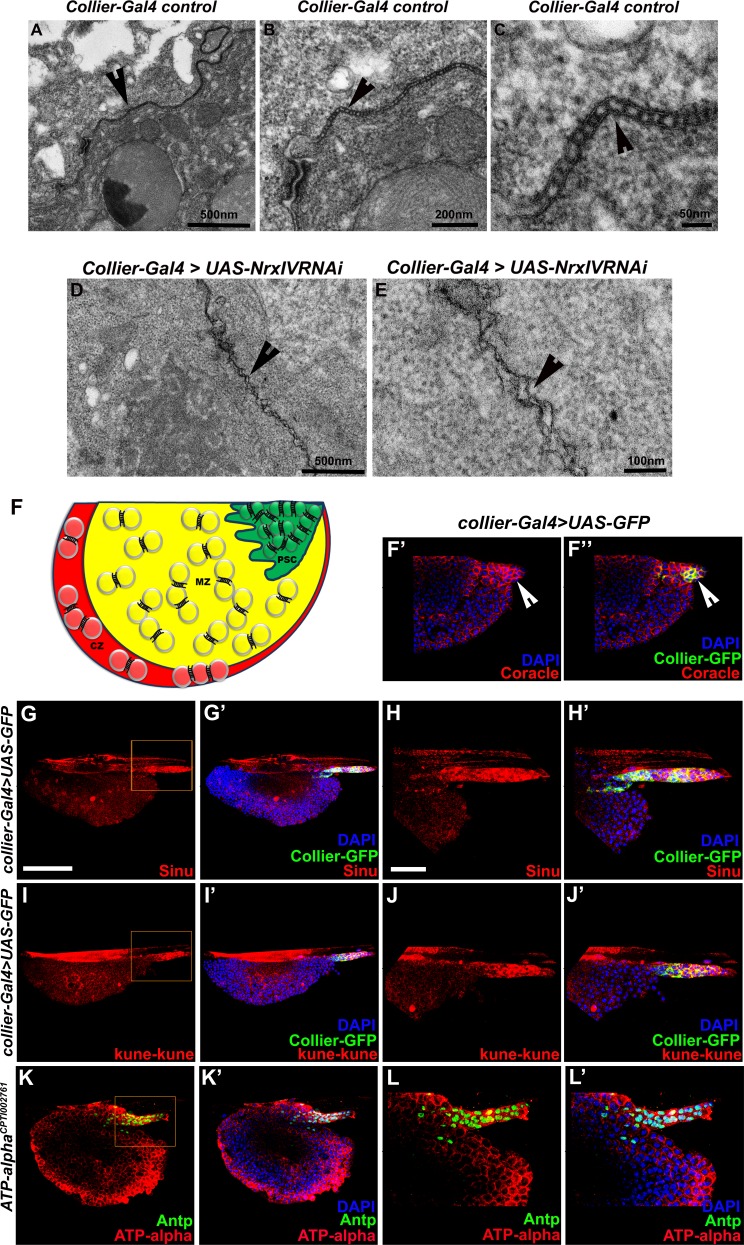
Figure 1—figure supplement 2. Septate junctions in the PSC are absent upon PSC- specific depletion of septate junctions.

Figure 1—figure supplement 2.

(A–C) Low (A), middle (B) and high (C) magnification electron micrographs of septate junctions in between the cells in the PSC. (D–E) Electron micrographs of the PSC cells showing that septate junctions fail to form and are disorganized upon PSC- specific depletion of NrxIV (collier-Gal4 >UAS NrxIVRNAi). (F) Septate junction localization in the PSC and the primary lymph gland lobe of the LG. High expression of Coracle (Red) is also found in the PSC cells that are close to the MZ region in the inner z-confocal sections of the lymph gland lobe (F’–F’’). (H–L’) are high magnification images of the boxed regions in (G–K’) showing high levels of expression of Sinuous (Red, G–H’), Kune-kune (Red, I–J’) and ATPα tagged with YFP (Green, K–L’). PSC is labeled with Collier-GFP (green; UAS-GFP driven by collier-Gal4, F’–J’) or Antennapedia (Red, K–L’). White arrows indicate high expression of Coracle in the PSC cells that are closer and further inside the MZ. Nuclei are labeled with DAPI (Blue). Scale Bar: (A,D) 500 nm, (B) 200 nm, (C) 50 nm, (E) 100 nm, (G–K’) 50 μm and (F–F’’, H–L’) 40 μm.