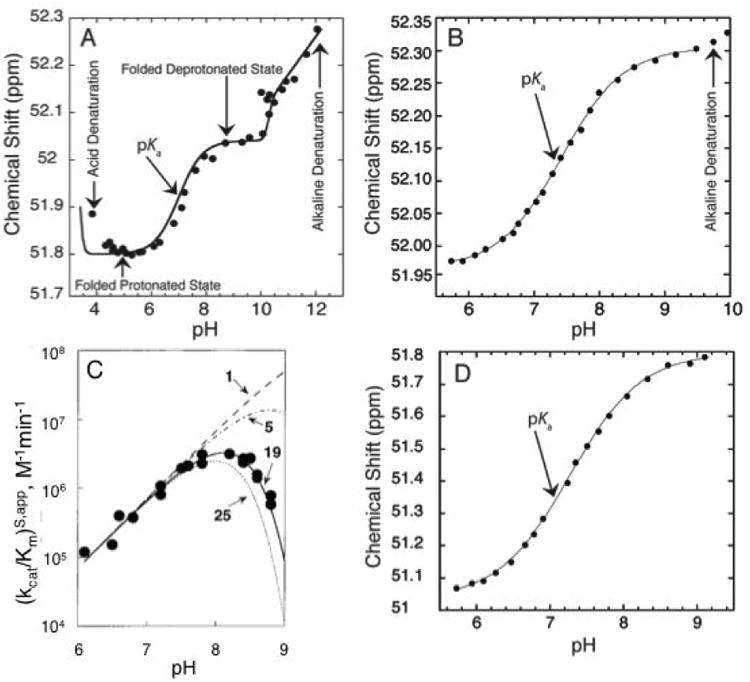
Figure 3.

Different factors affecting observed pKa. A) 1P NMR-based pH titration over a wide pH range (4.0-12.0) of a 19 mer dsDNA containing an A+•C wobble base pair. The plot shows five regions: acid denaturation (negative slope between pH ∼3.8-4.5), protonated folded state (flat slope between pH ∼4.5-6.0), ionization of the wobble base pair (positive slope between pH∼6.0-8.0), deprotonated folded state (flat slope between pH ∼8.0-10.0), and alkaline dentaturation (positive slope between pH ∼10.0-12.0). Adapted with permission from Siegfried et al. 2010. Copyright (2010) American Chemical Society. B) 31P NMR-based pH titration of DNA with interference from alkaline denaturation. The data above pH 9.4 were not included in the fit to Eq. (3) to obtain pKa. Adapted with permission from Wilcox et al. 2013. Copyright (2013) American Chemical Society. C) The pH-dependent cleavage of RNA under constant Na+ concentration. The different lines represent the number of independent ionizations affecting the observed pKa. The solid line represents 19 independent ionization events each with a microscopic pKa∼9.4, which gives rise to an apparent pKa of ∼7.6. Adapted with permission from Knitt et al. 1996. Copyright (1996) American Chemical Society. D) 31P NMR-based pH titration of DNA with no interference from unfolding. The observed pKa is close to neutrality and is easily determined with the ideal complete baselines. Adapted with permission from Wilcox et al. 2013. Copyright (2013) American Chemical Society.
