
Figure 4.
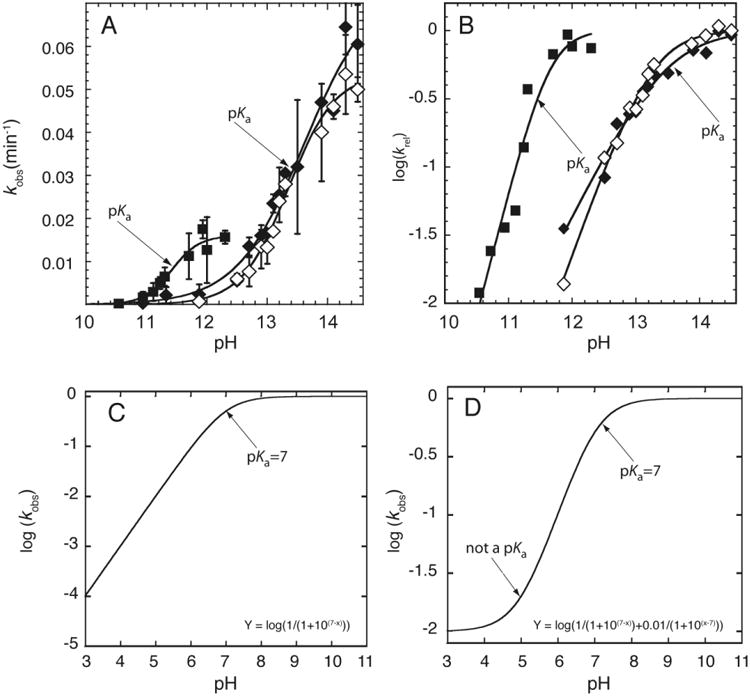
RNA cleavage kinetics-based determination of pKa. A) Plot of kobs versus pH. The pKa is determined by fitting the plot to Eq. (2). The pKa can be visually identified by the inflection point, which is the point at which kobs is equal to half of the kmax. Adapted with permission from Ganguly et al. 2014. Copyright (2014) American Chemical Society. B) Plot of log (kobs) versus pH. The pKa is determined by fitting the plot to Eq. (2b). The rounding or ‘flex’ point and the slope of the line in the log linear region can be utilized to visually determine the pKa and the Hill coefficient, respectively. Adapted with permission from Ganguly et al. 2014. Copyright (2014) American Chemical Society. C & D) Simulated plot of log (kobs) versus pH, in which (C) the rate increases log linearly (slope ∼ 1) with pH, and (D) the rate decreases log linearly and then levels off at low pH without a low pKa (Adapted from Bevilacqua et al. 2003).