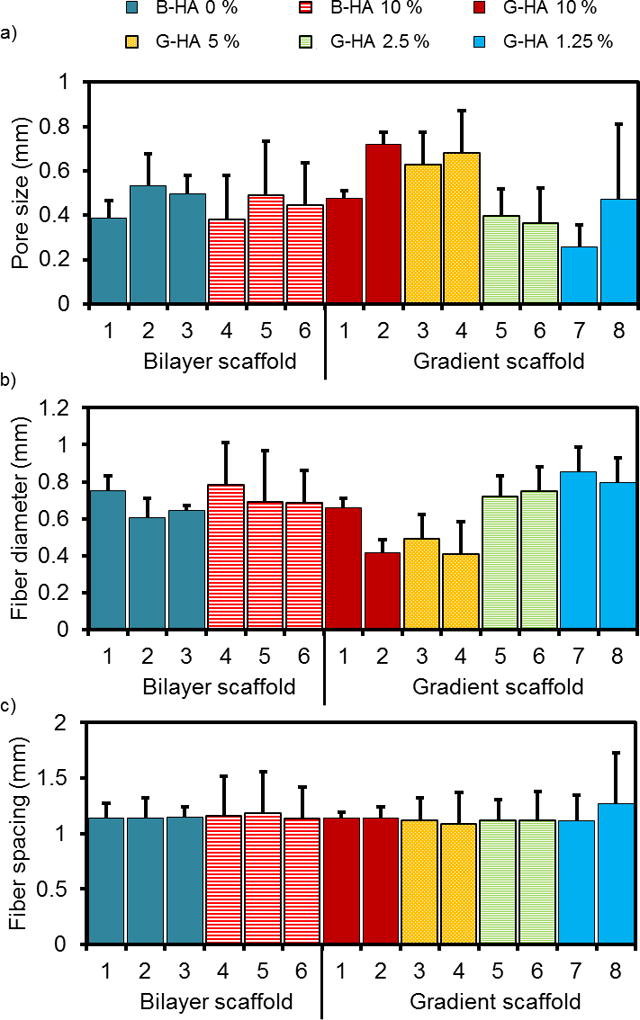
Figure 8.

(a) Pore size, (b) fiber diameter, and (c) fiber spacing measurements organized by scaffold type (bilayer or gradient descending), layer number (1–6 or 1–8), and HA concentration (0–10 wt%). (n = 4 scaffolds per group, 5 measurements per layer for a total of 20 measurements per datum). Data reported as mean + standard deviation (n = 4).
