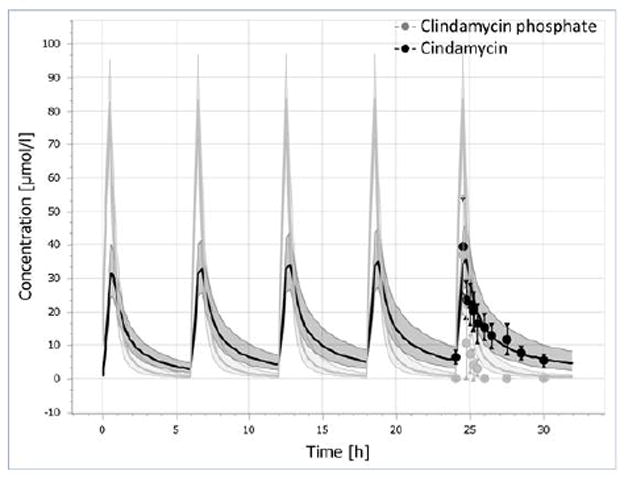
Figure 3.

Observed (dots) and simulated (lines) plasma concentration-time profiles of clindamycin phosphate and clindamycin following IV administration of 600 mg clindamycin phosphate every 6 hours in healthy adults. Solid lines represent geometric mean of the simulated data. The shaded area represents geometric mean ± geometric SD for the simulated data. Symbols represents mean and SD for the observed data.
