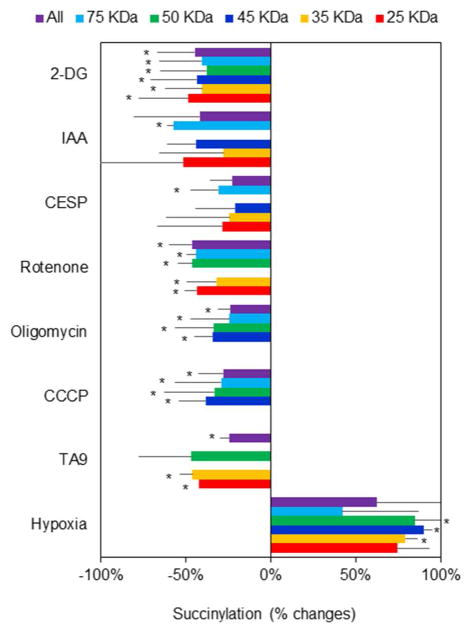
Figure 5.
The effects of various metabolic perturbations on succinylation. Conditions for each manipulation were exactly as for determining the NAD+/NADH ratios.
N2a cells were seeded on the 10 cm dishes at the density of 8 × 10⁶ cells/dish and cultured for two days. After two days of culture, the cells were treated with 2-DG (15 mM), IAA (5 μM), CESP (100 μM), Rotenone (5 μM), Oligomycin (10 μM), CCCP (5 μM), TA9 (5 μM) for 20 min at 37°C. For the hypoxia experiments, cells were incubated with hypoxia (2.4% O2) for 1 hour at 37°C. The mitochondrial fractions from different treatments were isolated and immnuoprecipitated with Pan anti-succinyllysine antibody overnight at 4°C and separated by Western blot. Each band reflects succinylation of many proteins so the results are quite variable. Data were the changes of succinylation compared with control group from different bands of protein expression after rejecting the outliers with Q-test. *Values vary significantly (p<0.05) from control by ANOVA followed by the Tukey test. df (degree of freedom) and F values in each groups are shown in the following table.
| Treatment | 2-DG | IAA | CESP | Rotenone | Oligomycin | CCCP | TA9 | Hypoxia |
|---|---|---|---|---|---|---|---|---|
| df (between groups) | 6 | 5 | 5 | 5 | 4 | 4 | 4 | 6 |
| df (within groups) | 41 | 16 | 34 | 34 | 33 | 33 | 15 | 15 |
| F | 12.8 | 5.4 | 4.0 | 66.0 | 15.9 | 10.9 | 16.0 | 6.4 |

