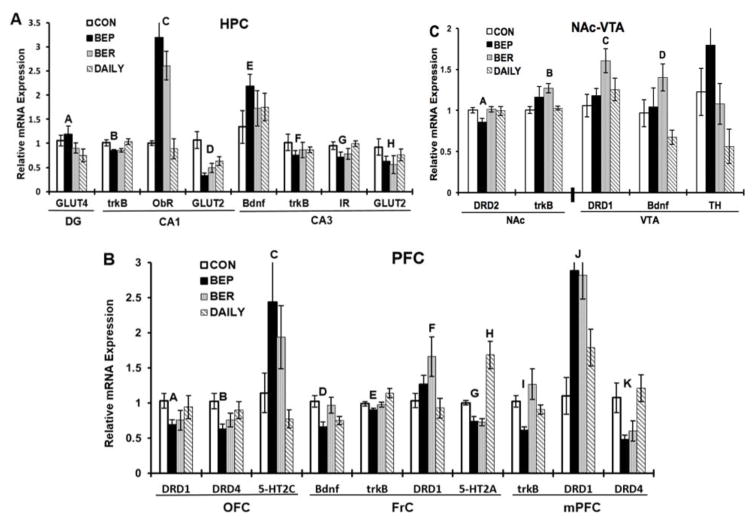
Figure 3. Gene expression.
mRNA is expressed as the normalized relative expression to the control chow fed group (CON). A: Expression in HPC: ‘A’- indicates significant increase in DG Glut4 expression in BEP group as compared to DAILY (p<0.05). ‘B’- indicates significant decrease in the CA1 TrkB expression in BEP as compared to CON group (p<0.05). ‘C’- indicates significant increase in the CA1 ObR expression in BEP and BER as compared to CON and DAILY groups (p<0.001). ‘D’- indicates significant decrease in the CA1 Glut2 expression in BEP (p<0.001), BER (p<0.01), and DAILY (p<0.05) groups as compared to CON. ‘E’- indicates significant increase in the CA3 Bdnf expression in BEP group as compared to CON (p<0.05). ‘F’- indicates significant decrease in the CA3 TrkB expression in BEP group as compared to CON (p<0.05). ‘G’- indicates significant decrease in the CA3 Ir expression in BEP group as compared to CON (p<0.05). ‘H’- indicates significant decrease in the CA3 Glut2 expression in BEP (p<0.01) and BER (p<0.05) groups as compared to CON group. B: Expression in PFC: ‘A’- indicates significant decrease in the OFC Drd1 expression in BEP group as compared to CON (p<0.05). ‘B’- indicates significant decrease in the OFC Drd4 expression in BEP group as compared to CON (p<0.05). ‘C’- indicates significant increase in OFC 5-HT2C expression in BEP group as compared to CON and DAILY groups (p<0.05). ‘D’- indicates significant decrease in the FrC Bdnf in BEP group as compared to CON (p<0.05). ‘E’- indicates significant decrease in the FrC TrkB expression in BEP as compared to DAILY group (p<0.05). ‘F’- indicates significant increase in the FrC Drd1 expression in BER group as compared to DAILY (p<0.05). ‘G’- indicates significant decrease in the FrC 5-HT2A expression in BEP as compared to CON (p<0.05) and DAILY groups (p<0.005). ‘H’- indicates significant increase in the FrC 5-HT2A expression in DAILY as compared to CON, BER, and BEP groups (p<0.005). ‘I’- indicates significant decrease in the mPFC TrkB expression in BEP group as compared to BER (p<0.005) and CON (p<0.05) groups. ‘J’- indicates significant increase in the mPFC Drd1 expression in BEP and BER as compared to CON group (p<0.05). ‘K’- indicates significant decrease in the mPFC Drd4 expression in BEP and BER as compared to DAILY groups (p<0.01) and in BEP group as compared to CON group (p<0.05). C: Expression in NAc-VTA: ‘A’- indicates significant decrease in the NAc Drd2 expression in BEP as compared to BER and CON groups (p<0.05). ‘B’- indicates significant increase in NAc TrkB expression in BER as compared to DAILY group (p<0.05). ‘C’- indicates significant increase in VTA Drd1 expression in BER group as compared to CON (p<0.05). ‘D’- indicates significant increase in VTA Bdnf in BER as compared to DAILY (p<0.005) and CON (p<0.05) groups.

