
Figure 1.
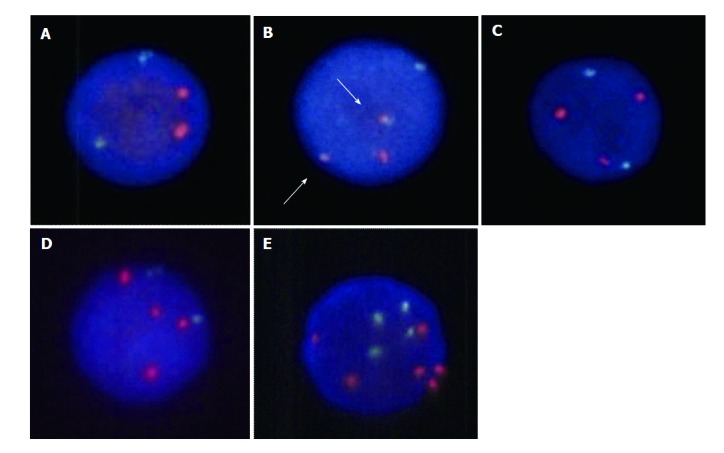
FISH images of the lymphoma cells. In the FISH analysis for t(11;18)(q21; q21) translocation, API2 is visualized as a green signal and MALT1 as a red signal. A: Two green signals and two red signals are seen in cases without t(11;18) translocation or extra copies of MALT1. B: Fusion genes of API2-MALT1 are detected as yellow signals, indicating t(11;18) translocation (B, arrows). C: Although no fusion genes are visible, an extra copy of MALT1 is noted, indicating trisomy 18. D: Two extra copies of MALT1 are visible, indicating tetrasomy 18. E: In one patient, several lymphoma cells have six MALT1 signals with four API2 signals, which is considered as trisomy 18 with tetraploidy.