
Figure 1.
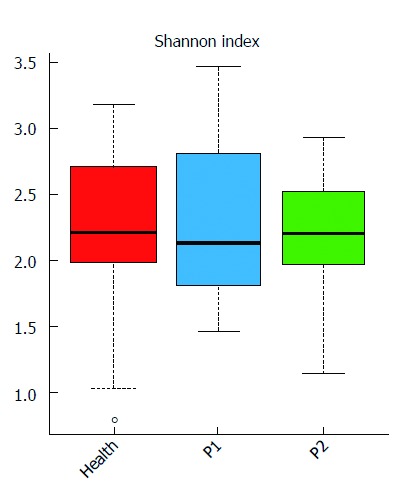
Gut microbial diversity of the three groups. Distribution of Shannon index (evenness) is shown. Red, blue, and green represent the Health, P1 and P2 groups, respectively. The gut microbiota (GM) of the healthy infants was more stable than that of the other two groups.