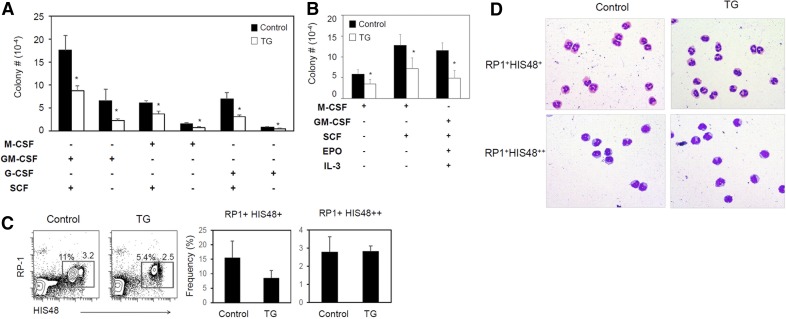
Figure 1. Decreased myelopoiesis in LRRK2 G2019S rats.
(A) Numbers of myeloid cell colonies formed in agar from the bone marrow progenitors of control and LRRK2 G2019S rats. (B) Numbers of myeloid cell colonies formed in methylcellulose from the bone marrow of control and LRRK2 G2019S rats. (C) Expression of RP-1 and HIS48 by peripheral blood myeloid cells. (D) Wright-Giemsa staining of sorted RP-1+ cell subsets. Blood RP-1+ cells were sorted into HIS48+ and HIS48++ cells. Representative dot plots and images and pooled data (n = 3–6) from 2–3 individual experiments are shown. *Significant differences (P ≤ 0.05) from control groups. Error bars indicate means ± sem.

