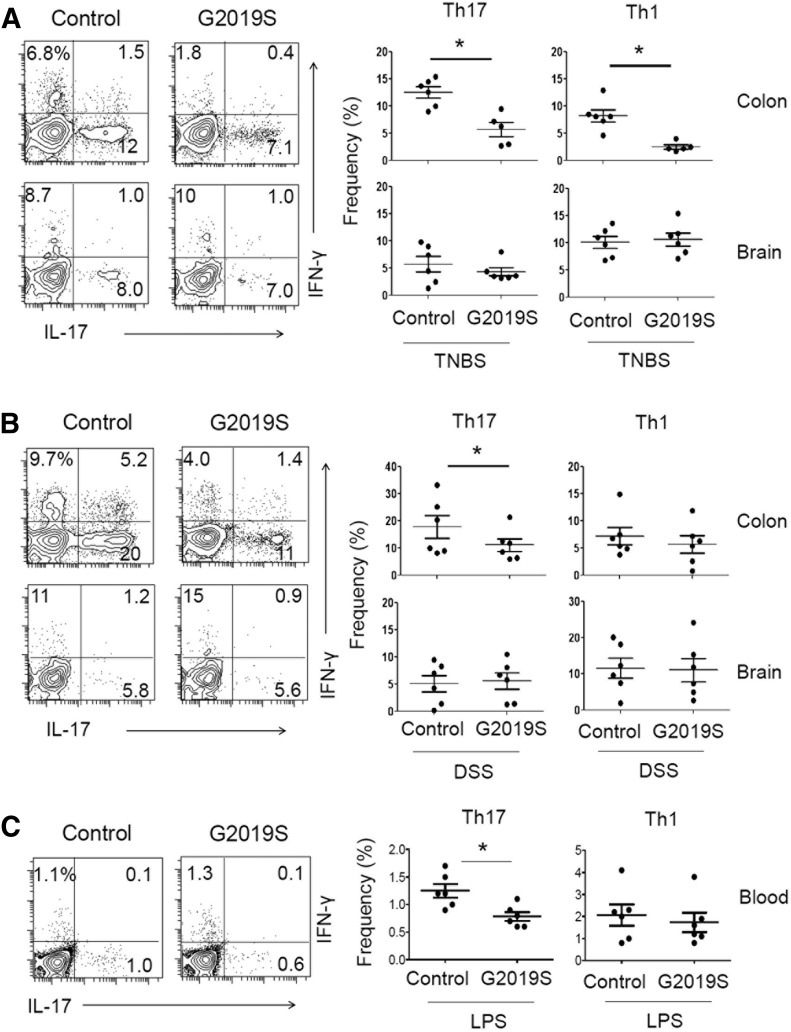
Figure 3. Th17 cell frequency in the colon, brain, and blood of LRRK2 G2019S rats during intestinal or systemic inflammatory responses.
Frequencies of IL-17+ Th17 cells and IFN-γ+ Th1 cells in the colon, brain, or blood cells were examined in rats challenged with TNBS (A), DSS (B), and LPS (C). Control and G2019S rats were treated with TNBS, DSS, or LPS, as described in Supplemental Fig. 1. Rats were sacrificed 6 (A), 25 (B), or 15 d (C) later, and cells were isolated from the indicated tissues were examined for intracellular cytokine expression. Representative dot plots and pooled data (n = 5–6) from 2 individual experiments are shown. *Significant differences (P ≤ 0.05) from control groups. Error bars indicate means ± sem.

