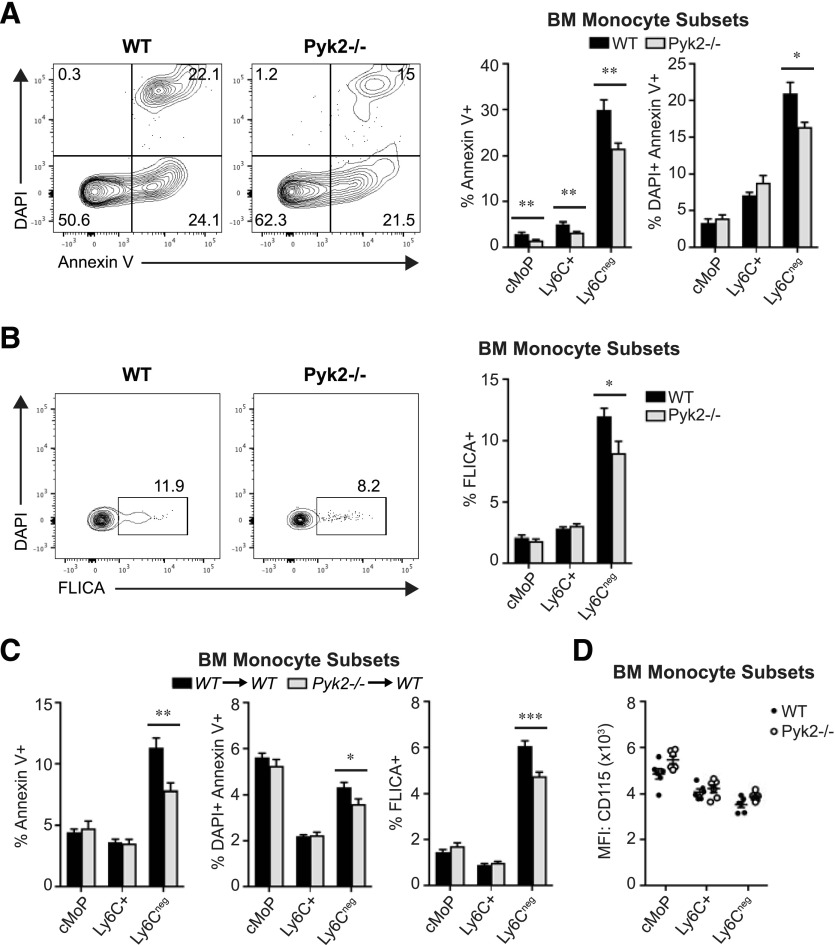
Figure 5. Pyk2 regulates Ly6C− BM monocyte survival in vivo.
(A) Representative contour plots display Annexin V staining and DAPI incorporation in BM Ly6C− monocytes from WT and Pyk2−/− mice, assessed by flow cytometry. The adjacent graphs show the average percentage of apoptotic (DAPI−/Annexin V+, left) or dead (DAPI+/Annexin V+, right) monocytes in BM monocyte subpopulations (WT, n = 8; Pyk2−/−, n = 8). Data were acquired from 2 independent experiments. (B) Representative contour plots display active caspase (FLICA) staining in BM Ly6C− monocytes from WT and Pyk2−/− mice, assessed by flow cytometry. The adjacent graph shows the percentage of BM monocyte subsets expressing cleaved (active) caspases, assessed by flow cytometry (WT, n = 8; Pyk2−/−, n = 8). Data were acquired from 2 independent experiments. (C) Percentage of BM monocyte subsets staining positive for Annexin V (left), DAPI (middle), or cleaved caspases (right) in WT→WT and Pyk2−/−→WT chimeric mice, assessed by flow cytometry (WT→WT, n = 12; Pyk2−/−→WT, n = 12). (D) Quantification of the mean fluorescence intensity of cell-surface CD115 (M-CSFR) for WT and Pyk2−/− BM monocyte subpopulations. *P < 0.05; **P < 0.01; ***P < 0.001 (unpaired Student’s t test).

