Fig. 4.

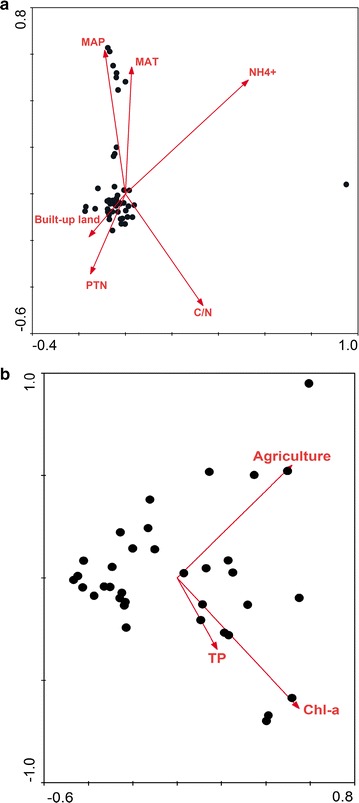
RDA or CCA ordination plots for the first two principal dimensions of the relationship between the AOB (a) and AOA (b) community compositions with the environmental parameters

RDA or CCA ordination plots for the first two principal dimensions of the relationship between the AOB (a) and AOA (b) community compositions with the environmental parameters