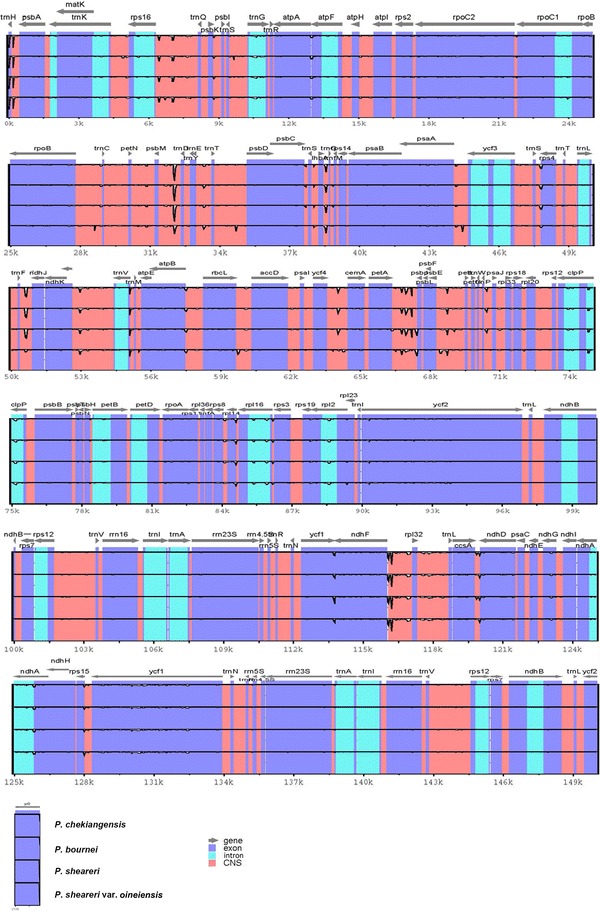
Fig. 5.

Sequence identity plots among chloroplast genomes of P. chekiangensis, P. bournei, P. sheareri, and P. sheareri var. oineiensis, with Machilus yunnanensis as a reference. Annotated genes are displayed along the top. The vertical scale represents the percent identity between 50 and 100%. Genome regions are color coded as exon, intron, and conserved non-coding sequences (CDS)
