Figure 3.

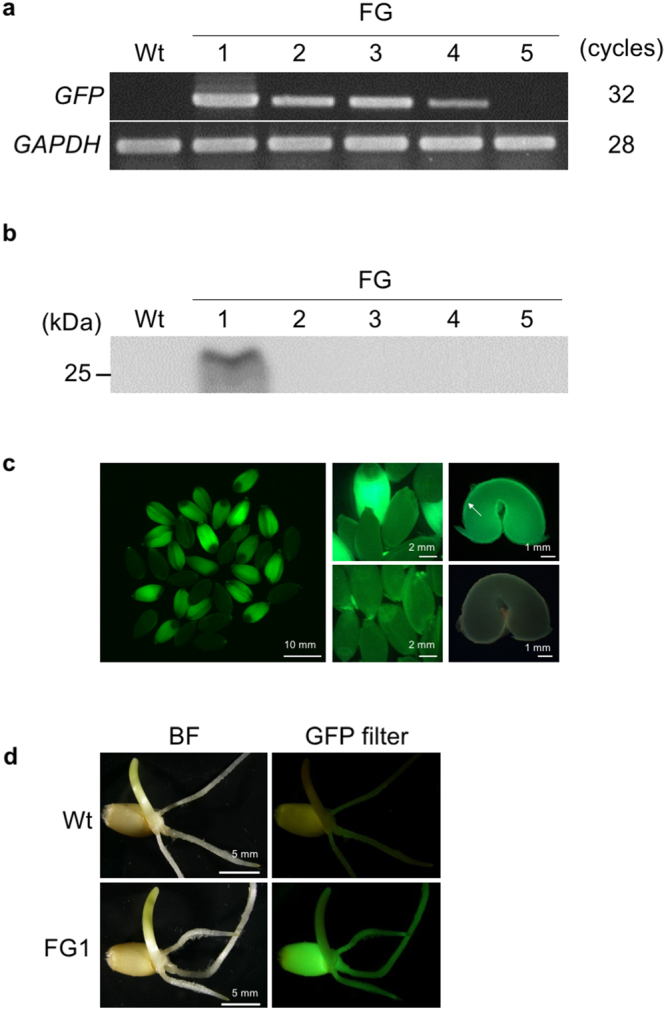
Expression of GFP in transgenic wheat plants. (a) Reverse transcription polymerase chain reaction (RT-PCR) analysis of GFP in ‘Fielder’ lines (FG1–5) and wild-type (Wt) plants. The GAPDH gene (Genbank accession number: EF592180) was used as a housekeeping control. Full-length gel images are shown in Supplementary Fig. S7. (b) Immunoblot analysis of green fluorescent protein (GFP) in transgenic plants (FG1–5). Total protein (20 µg per lane) extracted from each T1 leaf tissue was separated using sodium dodecyl sulphate-polyacrylamide gel electrophoresis (SDS-PAGE) and blotted. GFP was detected with anti-GFP antibodies. The full-length gel image is shown in Supplementary Fig. S8. (c) GFP accumulation in T1 seeds of a transgenic wheat line (FG1). Left: fluorescence image of whole T1 seeds harvested from the primary panicle of FG1. Middle: close-up views of T1 (upper) and Wt (lower) seeds. Right: fluorescence images of sections of FG1 T1 (upper) and Wt (lower) seeds. The aleurone cell layer is indicated by an arrow. (d) Bright-field (BF, left) and GFP (right) images of T1 seedlings in Wt (top) and FG1 (bottom) lines.
