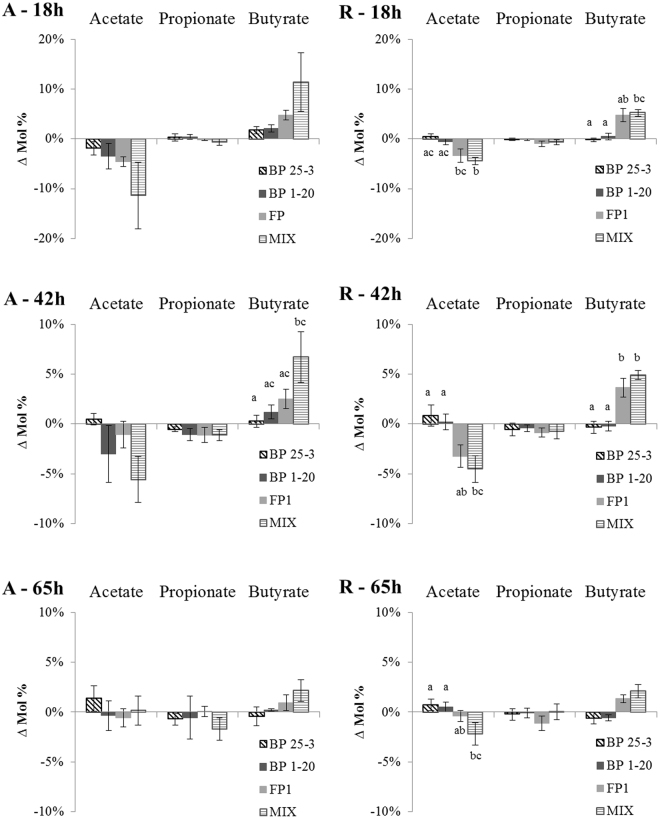
Figure 2.
Treatment with butyrate-producers results in higher butyrate production. Δ Mol% represents the difference in SCFA levels (acetate, propionate and butyrate) between samples treated with butyrate-producers and corresponding non-treated samples. Average values and SEM are plotted for samples of active CD (A) and CD in remission (R) after 18 h, 42 h and 65 h of treatment. Treatments are indicated with letter codes: BP 25-3: B. pullicaecorum 25-3; BP 1-20: B. pullicaecorum 1.20; FP: F. prausnitzii; MIX: mix of B. pullicaecorum 25-3, F. prausnitzii, R. intestinalis, R. hominis, E. hallii, A. caccae. Significant differences at 0.05 level between treatments are indicated with different letter codes, the averages of bars with the same letter in their letter code are not significant different from each other.

