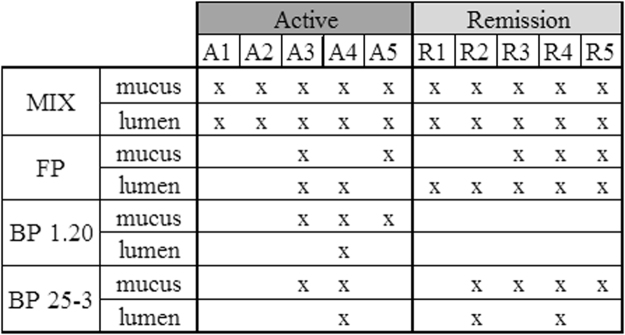
Figure 3.
Colonization success of different treatments in mucus and lumen samples of CD microbiota (A: active; R: remission) at end of incubation. Based on group-specific DGGE profiles by comparing the relative intensity of the band classes of the different butyrate-producing species used in treatments between non-treated and treated samples. Colonization success of the supplemented butyrate-producers was defined if the relative intensity in the treated sample was higher as in the non-treated sample. In case of the MIX, there was a colonization success defined if the relative intensity of the band class of at least one species was higher in treated sample. Treatments are indicated with letter codes: BP 25-3: B. pullicaecorum 25-3; BP 1-20: B. pullicaecorum 1.20; FP: F. prausnitzii; MIX: mix of B. pullicaecorum 25-3, F. prausnitzii, R. intestinalis, R. hominis, E. hallii, A. caccae.

