Figure 5.
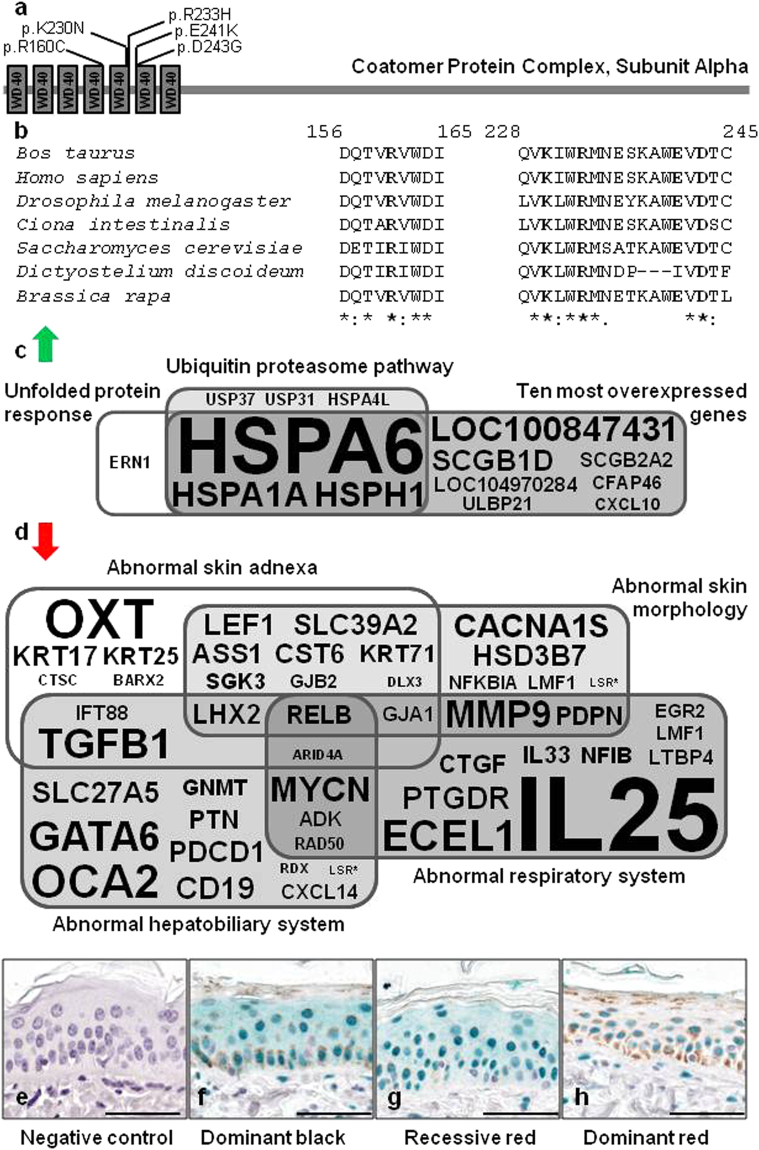
Characterization of the effect of bovine p.R160C substitution in COPA. (a) Domain information for COPA obtained from the UniProt database (http://www.uniprot.org/; accession numbers: Q27954 and P53621) and localization of the natural mutations described in cattle (p.R160C) and in human (p.K230N, p.R233H, p.E241K, p.D243G). The coordinates are identical in human and bovine orthologs due to the strong conservation of the WD40 domain that interacts with dilysine motifs44. (b) Multispecies alignment of COPA proteins illustrating the strong conservation of the mutated residues among eukaryotes. Protein sequences accession numbers in Ensembl are respectively ENSBTAP0000000567, ENSP00000357048, FBpp0072694, ENSCINP00000018763, YDL145C, EAL73444 and Bra010674.1-P. (c) Ingenuity Pathway Analysis on genes that are markedly upregulated in the skin of dominant red versus dominant black Holstein cattle (fold change ≥2; FDR < 0.05; according to the RNAseq data produced by Dorshorst et al.41; Supplementary Data 1) identifies the unfolded protein response and ubiquitin proteasome pathway as the two most significantly enriched canonical pathways (P < 0.001). (d) Functional annotation of downregulated genes in the same RNAseq data using Enrichr46, 47 reveals a significant enrichment (P < 0.05) for four “MGI Mammalian Phenotype Level 3′. Results of gene set enrichment analyses are presented in Supplementary Tables 8 and 9. Font size is proportional to the fold change in (c) and to the inverse of the fold change in (d). (e–h) Immunohistochemical analysis with rabbit polyclonal antibodies against NFI transcription factors in epidermis from dominant black (MC1RD/D, DR+/+), recessive red (MC1Re/e, DR+/+), and dominant red (MC1RD/D, DRDR/+) Holstein animals. Scale bars correspond to 50 µm. NFI proteins are revealed with HRP-Green system, and all samples have been counterstained with hematoxylin. Staining is absent in negative control (a; recessive red), shows a nuclear and cytoplasmic distribution in dominant black (f) and recessive red (g) skins, while the distribution is only nuclear in dominant red skin (h). This observation was confirmed in samples from different animals (n = 3, 2 and 3 for f–h respectively).

