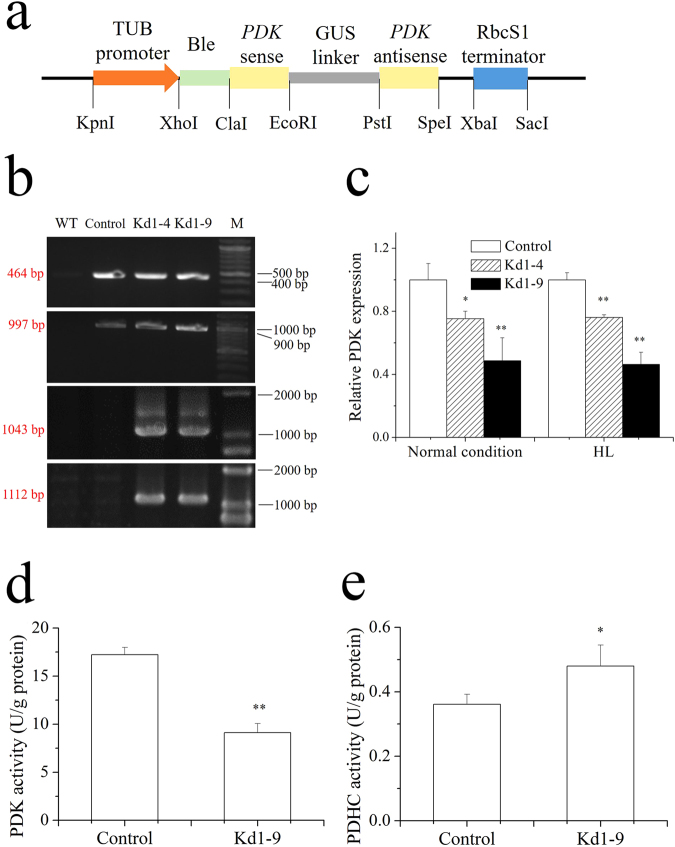
Figure 3.
The RNAi vector and identification of plasmids in transgenic cells. (a) Schematic diagram of plasmid pGreen II 0000. (b) Detection of bleomycin resistant fragment (464 bp), GUS region (997 bp), fragment crossing sense and GUS sequence (1043 bp) and fragment crossing GUS and antisense sequence (1112 bp) from transgenic N. salina (shown in four cropped panels, and full-length gels are presented in Supplementary Fig. 1). (c) Transcriptional abundance of PDK in transformants determined by qRT-PCR. The data was obtained on day 6 with normal condition and day 2 with the stress of high light. The endogenous actin gene was used as an internal standard and the mRNA abundance of control was set as 1. (d) PDK activity of Kd1-9 and control. (e) PDHC activity of Kd1-9 and control. The data was obtained on day 2 with the stress of high light for d and e. TUB, β-tubulin; PDK, pyruvate dehydrogenase kinase; GUS, β-glucuronidase; RbcS1, ribulose-1,5-bisphosphate carboxylase/oxygenase small subunit. WT, wild type; Control, empty vector introduced N. salina; Kd1-4 and Kd1-9, transgenic N. salina; M, DNA ladder marker. Values are presented with average and SD from at least three biological replicates. Asterisk (*p < 0.05 and **p < 0.01) means significant differences between control and transformants, using independent samples t-test and one way ANOVA Turkeys HSD test.

