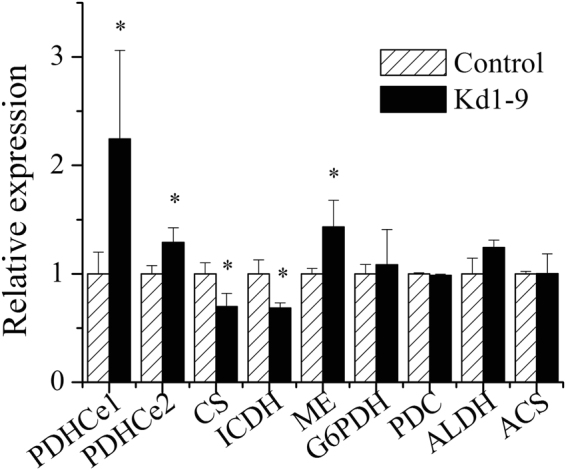
Figure 7.

Relative expression levels of key genes in transgenic cells after 42 hours of cultivation with high light. The mRNA abundance of control was set as 1. Values are presented with average and SD from at least three biological replicates. Asterisk (*p < 0.05) means significant differences between control and Kd1-9, using independent samples t-test. Control, empty vector transgenic line; Kd1-9, NsPDK knockdown line. PDHCe1, pyruvate dehydrogenase complex E1 component; PDHCe2, pyruvate dehydrogenase complex E2 component; CS, citrate synthase; ICDH, isocitrate dehydrogenase; ME, malic enzyme; G6PDH, glucose-6-phosphate dehydrogenase; PDC, pyruvate decarboxylase; ALDH, aldehyde dehydrogenase; ACS, acetyl-CoA synthase.
