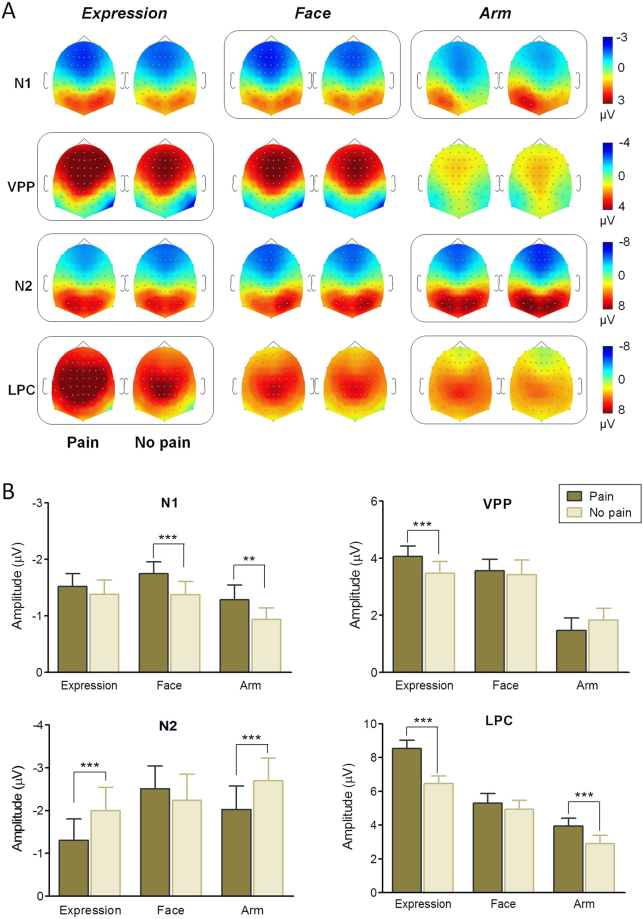
Figure 3.
Topographical maps and statistical results of ERP components. (A) Scalp topographies of N1, VPP, N2, and LPC components (from top to bottom), plotted separately for each experimental condition (from left to right: painful expressions, neutral expressions, needle-penetrated faces, Q-tip-touched faces, needle-penetrated arms and Q-tip-touched arms). Boxed plots indicate a significant difference in ERP amplitude revealed by a Bonferroni-corrected t test. (B) Post hoc comparisons on condition × category interaction effects for N1, VPP, N2, and LPC amplitudes were conducted separately. Asterisks indicate significant differences in amplitude. **P < 0.01; ***P < 0.001. Error bars represent standard errors of the mean.

