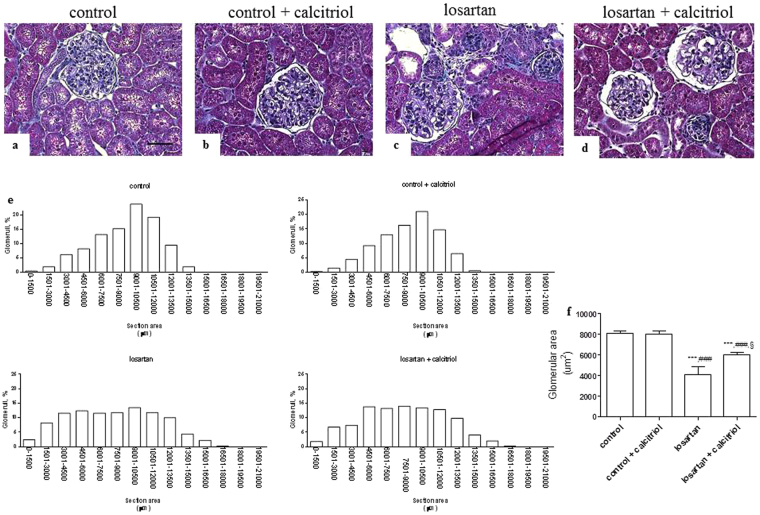
Figure 2.
Histological sections stained with Masson’s trichrome showing the distribution of the glomerular area from the control (a), control + calcitriol (b), losartan (c), and losartan + calcitriol (d) groups at 60 days of age. Scale bar = 50 μm. The population of smaller glomeruli is evidenced in the losartan group. (e) The frequency distribution of the glomerular areas in the groups. Non-Gaussian distribution is observed in the losartan group, and a subpopulation of smaller glomeruli in losartan and losartan + calcitriol can be observed. (f) Mean glomerular area of the control and experimental groups. Scale bar = 50 μm. Data are expressed as mean ± SEM. n = 7–12 animals per group. ***P < 0.001 vs. control; ### P < 0.001 vs. control + calcitriol; and § P < 0.05 vs. losartan.

