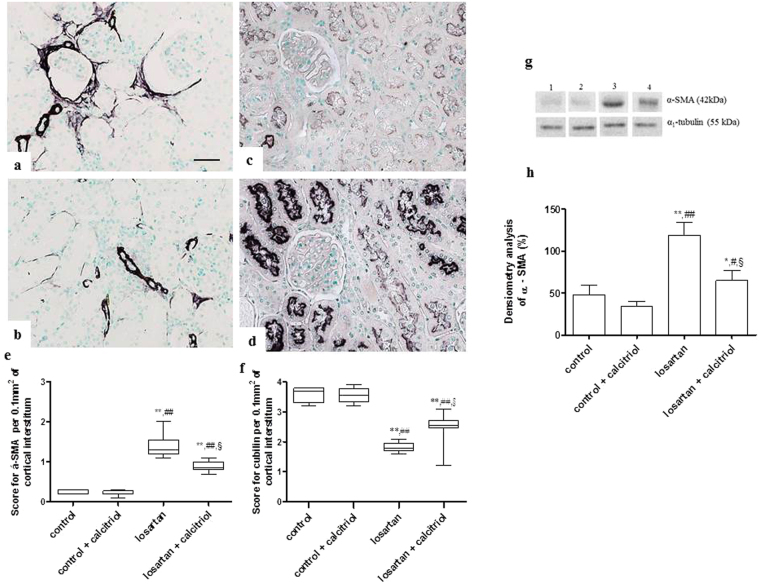
Figure 4.
Immunolocalization of α-SMA in the renal cortex from the losartan (a), losartan + calcitriol (b), and immunolocalization of cubilin from the losartan (c), and losartan + calcitriol (d) groups. Scores for α-SMA in the tubulointerstitial area (e) and cubilin (f) in the renal cortex. Scale bar = 50 μm. Western blot analysis of α-SMA and α1- tubulin (g) in renal cortex from control (lane 1), control + calcitriol (lane 2), losartan (lane 3) and losartan + calcitriol (lane 4) groups. Densitometry of α-SMA (h). A densitometric ratio between the densitometry of α-SMA and α1-tubulin was calculated and data are expressed in comparison to the control, with the mean (±SEM) control value designated as 100%. Blots are representative images from independent experiments (n = 5–6 for each group). Immunohistochemical data are expressed as median and interquartile range (25th–75th) and Western blot data are expressed as mean ± SEM (h). *P < 0.05, **P < 0.01, and ***P < 0.001 vs. control; # P < 0.05 and ## P < 0.01 vs. control + calcitriol; and § P < 0.05 vs. losartan. Note the increase in α-SMA and decrease in cubulin in losartan groups, which shows lack of cell differentiation.

