
Figure 2.
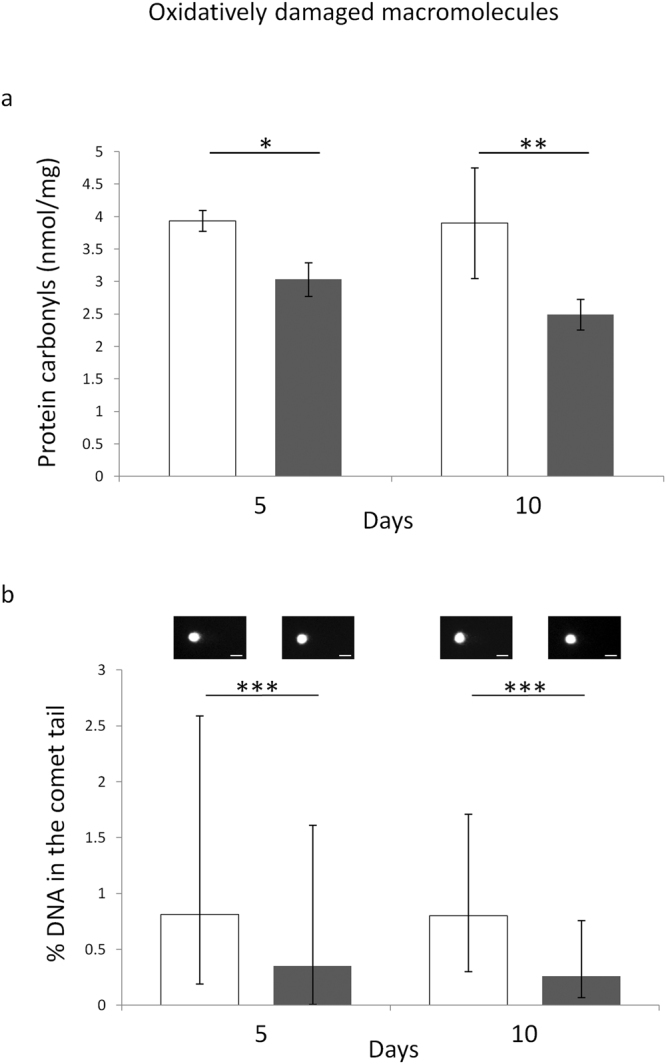
Effects of 5 or 10 days of ELF-MF exposure (1 mT, 50 Hz) on the levels of oxidatively modified proteins (panel a) and DNA (panel b) in SH-SY5Y human neuroblastoma cells. Empty histograms represent unexposed cells (sham), whereas gray histograms represent ELF-MF-exposed cells. Representative photographs of alkaline comets observed through fluorescence microscopy were reported in panel b (bar = 30 µm). Protein carbonyls were expressed as means ± s.d. Percentages of DNA in the comet tails were expressed as medians with interquartile ranges. *P < 0.05, **P < 0.01 (2 × 2 factorial ANOVA followed by post-hoc Newman–Keuls/Tukey tests for multiple comparison). ***P < 0.001 (Mann-Whitney rank sum tests).