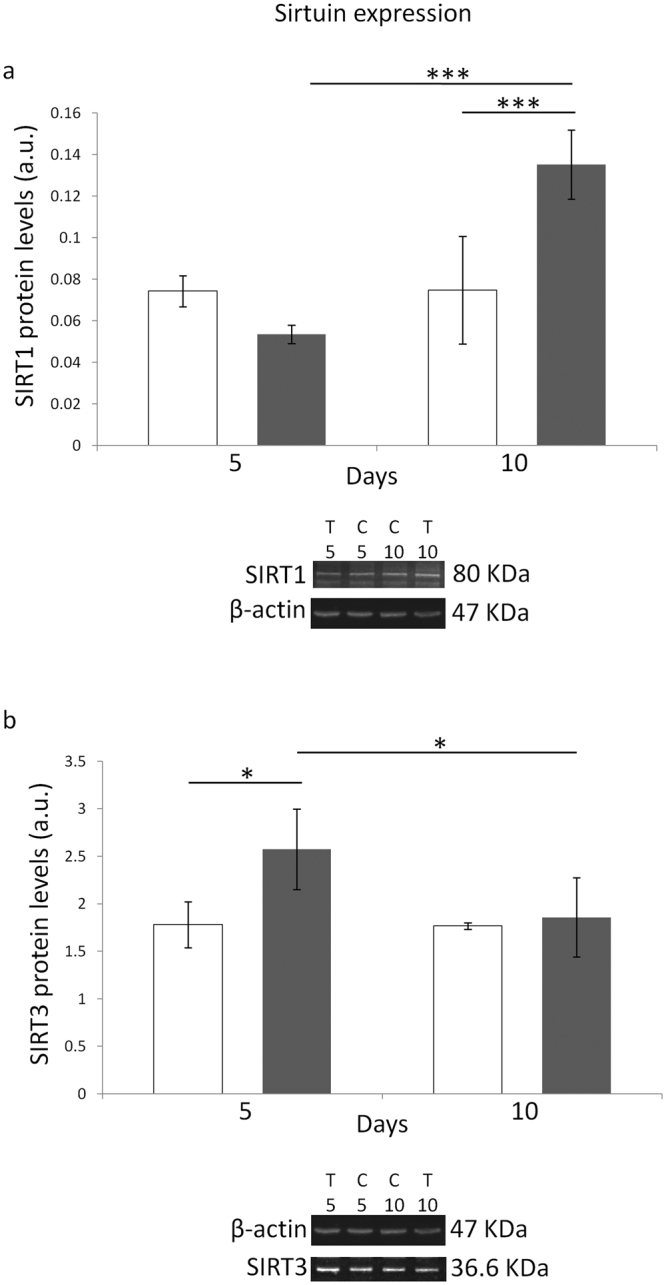
Figure 3.

Effects of 5 or 10 days of ELF-MF exposure (1 mT, 50 Hz) on the protein levels of SIRT1 (panel a) and SIRT3 (panel b) in SH-SY5Y human neuroblastoma cells. Empty histograms represent unexposed cells (sham), whereas gray histograms represent ELF-MF-exposed cells. Representative grouping of Western blots were reported in both panels, with clear white space delineation between the proteins of interest (i.e., SIRT1 and 3) and the loading control (i.e., β-actin). T5 and T10, exposed cells for 5 and 10 days, respectively (C5 and C10, time-matched unexposed controls). Values were expressed as means ± s.d. *P < 0.05, ***P < 0.001 (2 × 2 factorial ANOVA followed by post-hoc Newman–Keuls/Tukey tests for multiple comparison).
