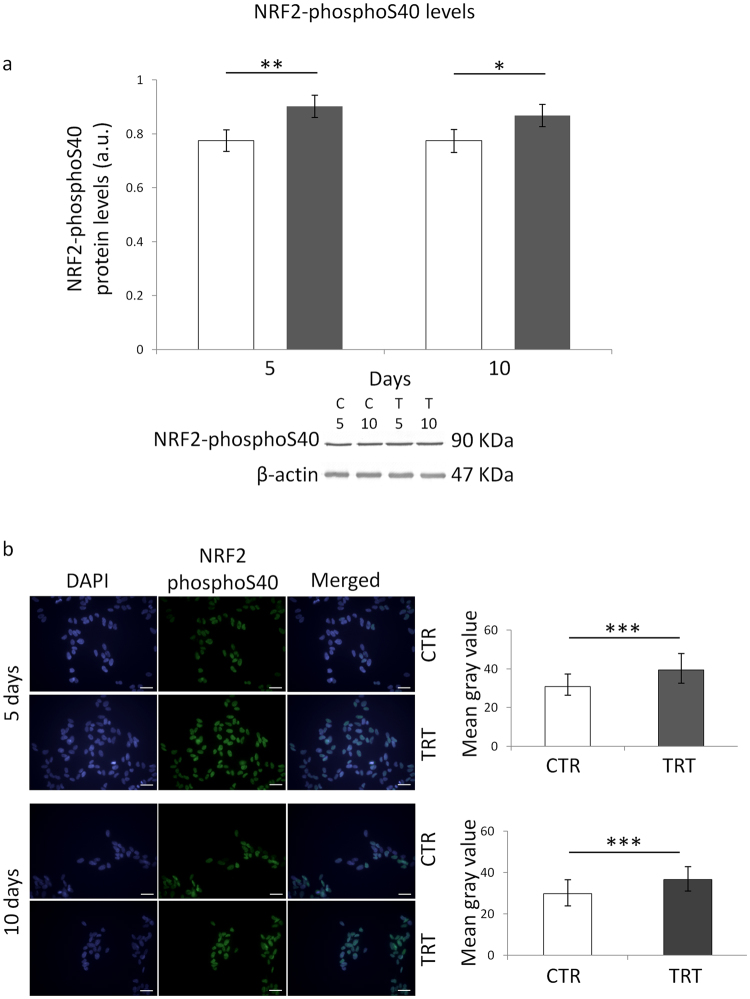
Figure 4.
Effects of 5 or 10 days of ELF-MF exposure (1 mT, 50 Hz) on the protein levels of NRF2-phosphoS40 in SH-SY5Y human neuroblastoma cells. Empty histograms represent unexposed cells (sham, CTR), whereas gray histograms represent ELF-MF-exposed (TRT) cells. Representative grouping of Western blots were reported in panel a, with clear white space delineation between the protein of interest (i.e., NRF2-phosphoS40) and the loading control (i.e., β-actin). T5 and T10, exposed cells for 5 and 10 days, respectively (C5 and C10, time-matched unexposed controls). Representative photographs of immunofluorescence microscopy were reported in panel b (bar = 40 µm). Western blotting-related results were expressed as means ± s.d. Immunofluorescence-related results were expressed as medians with interquartile ranges. *P < 0.05, **P < 0.001 (2 × 2 factorial ANOVA followed by post-hoc Newman–Keuls/Tukey tests for multiple comparison). ***P < 0.001 (Mann-Whitney rank sum tests).

