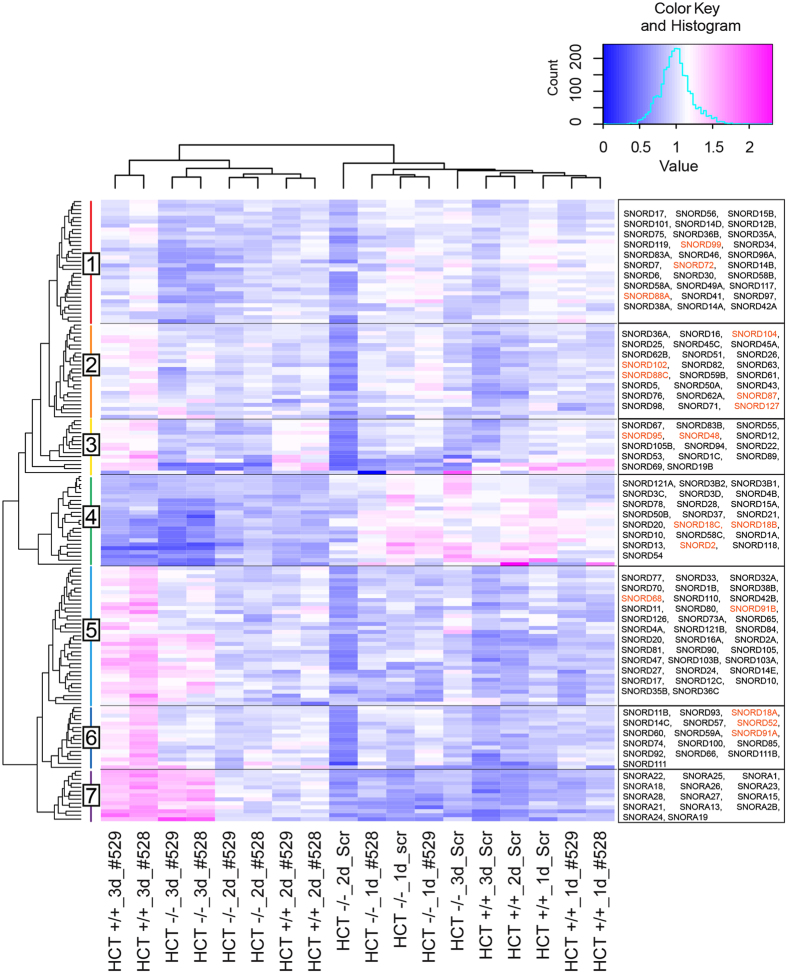
Figure 5.
Clustering of snoRNA levels according to their sensitivity to fibrillarin depletion. SnoRNA abundances were inferred from numbers of sequencing reads in the RiboMethSeq dataset and clustered with ‘R’ (hclust). All detected box C/D snoRNAs (SNORD) are represented (categories 1 to 6). Representative H/ACA snoRNAs (SNORA) are shown (category 7). The inset shows the color key and histogram. snoRNAs labelled in orange are involved in the modification of the variable positions identified in this work.

