Figure 3.
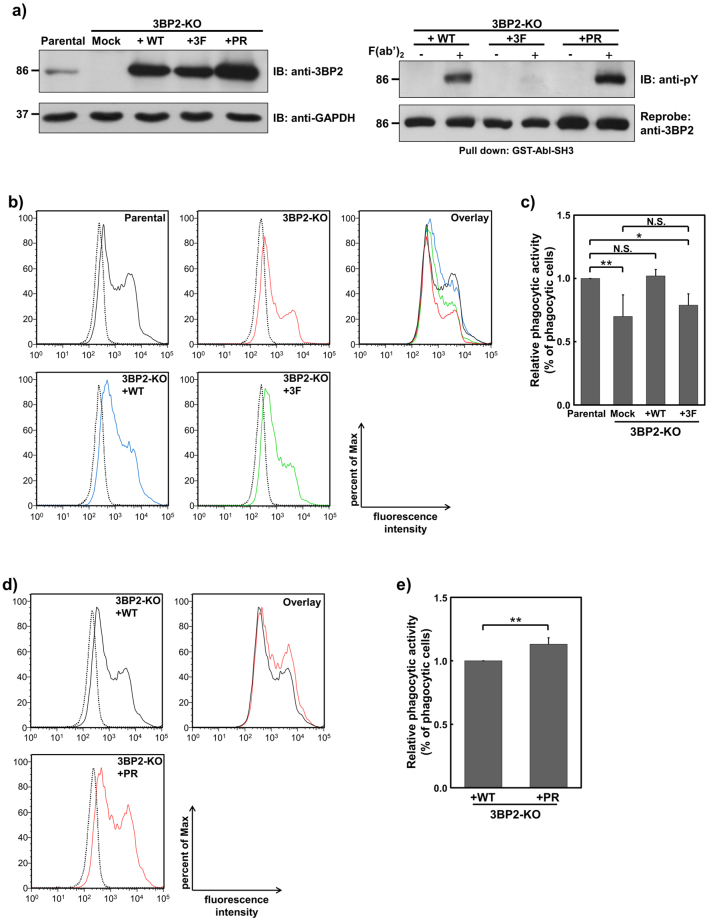
Effect of Syk-dependent tyrosine phosphorylation of 3BP2 and the cherubism mutation on FcRγ-mediated phagocytosis. (a) Establishment of 3BP2-knockout (KO) cells stably expressing HA-tagged 3BP2 (left panel). Protein lysates obtained from U937 (Parental) cells, 3BP2-KO cells, 3BP2-KO cells expressing HA-3BP2-WT (3BP2-KO+WT), HA-3BP2-3F (3BP2-KO+3F) or HA-3BP2-PR (3BP2-KO+PR) were separated by SDS-PAGE and analysed by immunoblotting. Tyrosine phosphorylation of HA-3BP2 induced by cross-linking of FcγRI (right panel). After the cells were stimulated without (−) or with (+) cross-linking of FcγRI (F(ab′)2), cell lysates were prepared and subjected to a pull-down assay. Proteins bound to GST tagged Abl SH3 domain (GST-Abl-SH3) were separated by SDS-PAGE and analysed by immunoblotting. Molecular size markers are indicated on the left in kDa. Data are representative of three independent experiments. Full-length blots are presented in Supplementary Fig. S1. Two cloned cells expressing each form of HA-3BP2 were established and similar results were obtained from both cell lines (Supplementary Fig. S2). (b and d) Phagocytic activity in the indicated cells. After the cells were incubated with opsonised zymosan for 0 min (dotted line) or 60 min (solid line), the fluorescence intensity of the cells was measured by flow cytometry. Histograms from each cell line were overlaid (Overlay) to compare phagocytic activity. Data are representative of three independent experiments. Similar results were obtained from both replicate cell lines (Supplementary Fig. S2). (c and e) Quantitative analyses of relative phagocytic activity in the indicated cells. The percentage of zymosan positive cells (% of phagocytic cells) was compared with data obtained from the Parental cells (c), or that obtained from the 3BP2-KO + WT cells (e). The relative values obtained from indicated cells are expressed as relative phagocytic activity. Results are shown as the mean ± SD of three independent experiments. Similar results were obtained from both replicate cell lines. *P < 0.01 and **P < 0.05 were considered statistically significant. N.S. = not significant.

